

Trading
Jelajahi berbagai pasar dengan harga kompetitif, likuiditas mendalam, dan alat trading canggih.
Pelajari Lebih Lanjut 
Platform
Trading dengan lancar menggunakan platform canggih TMGM, dibangun untuk kecepatan, presisi, dan pengalaman trading yang superior.
Pelajari Lebih Lanjut Platform Trading
Akademi
Pelajari dasar-dasar trading dengan sumber daya yang ramah pemula, termasuk panduan, webinar, dan wawasan pasar.
Pelajari Lebih Lanjut Berita & Analisis
Dapatkan update pasar real-time dan analisis ahli untuk tetap unggul dalam peluang trading
Pelajari Lebih Lanjut Berita & Analisis
Tentang
Pelajari apa yang membedakan TMGM — kehadiran global kami, kekuatan regulasi, dan komitmen terhadap inovasi dalam trading.
Pelajari Lebih Lanjut Mengapa Memilih TMGM
Sponsorship
Pound Inggris merosot karena Warsh kembali memicu spekulasi kenaikan suku bunga Fed
- GBP/USD merosot karena Warsh menempatkan perang melawan inflasi sebagai prioritas utama.
- Peluang kenaikan suku bunga Fed meningkat seiring kembalinya risiko pengetatan pada September.
- Revisi data pekerjaan dan data sentimen gagal melemahkan Dolar.
Pound Sterling merosot terhadap Greenback pada hari Jumat setelah Ketua Federal Reserve Kevin Warsh menempatkan inflasi sebagai prioritas bagi Fed, sehingga meningkatkan kemungkinan kenaikan suku bunga di akhir tahun. GB/USD diperdagangkan di 1.3538, turun 0.40%.
GBP/USD melemah saat Warsh tetap mempertahankan fokus Fed pada inflasi
Akhirnya, Warsh mengungkapkan sikapnya saat ini, meskipun tidak menempatkan titik proyeksinya pada dot plot bulan Juni dalam Summary of Economic Projections (SEP). Ia mengatakan bahwa data inflasi musim panas lebih baik dari perkiraan, tetapi mengakui bahwa inflasi inti belum membaik seperti yang ia harapkan. Ia menambahkan bahwa Fed harus yakin inflasi kembali ke target, jika tidak, “kita masih punya pekerjaan yang harus dilakukan.”

Warsh mengakui bahwa belanja konsumen sehat dan pasar tenaga kerja stabil. Namun terkait stabilitas harga, ia mengatakan bahwa angkanya “lebih mengkhawatirkan,” dan menegaskan kembali bahwa “target PCE 2% Fed bersifat tegas dan tetap.”
Setelah data tersebut, Indeks Dolar AS (DXY), yang melacak kinerja greenback terhadap enam mata uang, naik lebih dari 0.38% ke 99.49. Imbal hasil Treasury AS, khususnya imbal hasil acuan tenor 10 tahun, naik hampir 1.5 basis poin menjadi 4.686%, sementara investor meningkatkan peluang kenaikan suku bunga pada pertemuan September.
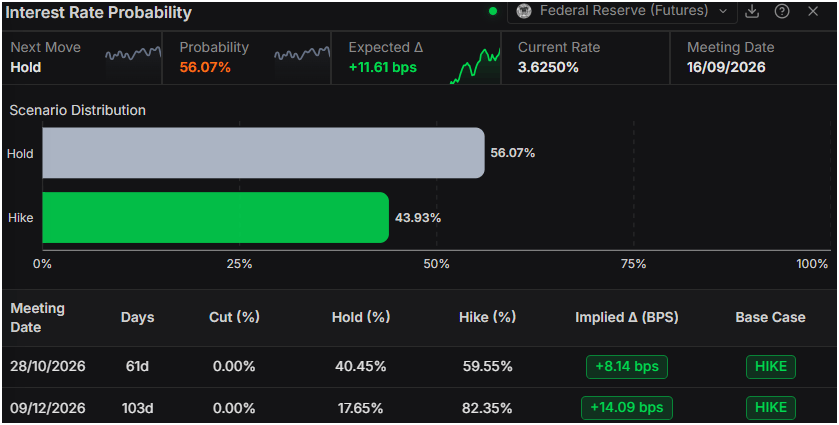
Alat probabilitas suku bunga Prime Terminal menunjukkan bahwa pasar uang menaikkan peluang kenaikan suku bunga Fed sebesar 25 basis poin dari 34% sehari sebelumnya menjadi 43% pada saat penulisan. Meski demikian, setelah komentar Warsh, peluang tersebut sempat setinggi 50%.
Selain itu, Revisi Tahunan Nonfarm Payrolls tercatat -79K, di bawah perkiraan 183K, membaik dari revisi sebelumnya sebesar -911K. Revisi acuan final akan dirilis pada Februari 2027 bersamaan dengan publikasi rilis berita Employment Situation Januari 2027.
Sentimen Konsumen University of Michigan (UoM) pada Agustus berada di 51.7, di atas estimasi 51, tetapi memburuk dibandingkan angka bulan Juli. Ekspektasi inflasi direvisi turun secara moderat untuk satu tahun, dari 4.2% menjadi 4%, sementara ekspektasi lima tahun tetap stabil di 3.3%, sejalan dengan perkiraan.
Dengan latar belakang tersebut, Cable melanjutkan tren turunnya karena kalender ekonomi Inggris tetap sepi, dengan Dolar AS dan geopolitik menjadi pendorong pergerakan.
Pekan depan agenda ekonomi Inggris akan menampilkan BoE Monetary Policy Report Hearings, serta pidato dari Gubernur BoE Bailey. Di AS, jadwalnya padat, dengan ISM PMI dan serangkaian data pekerjaan, dipimpin oleh rilis Nonfarm Payrolls bulan Agustus.
Prakiraan Harga GBP/USD: Prospek teknikal
Pada grafik harian, GBP/USD diperdagangkan di 1.3572, mempertahankan bias bullish yang konstruktif karena harga spot tetap berada di atas klaster support yang berhasil direbut kembali di area pertengahan 1.34. Tiga simple moving average di sekitar 1.3424 kini menopang kenaikan bersama dengan bekas hambatan garis tren yang kini berubah menjadi support di dekat 1.3487, 1.3397, dan 1.3392, sementara Relative Strength Index 14 hari yang sedikit positif di sekitar 57 menunjukkan pembeli masih memegang kendali tanpa belum memasuki wilayah jenuh beli.
Di sisi atas, resistance awal terlihat pada penembusan bekas garis tren naik di sekitar 1.3634, dan penutupan harian di atas level ini akan membuka jalan bagi kelanjutan kenaikan yang lebih tegas. Di sisi bawah, setiap pullback kemungkinan akan menemukan permintaan pertama di dekat 1.3487, sebelum area tiga simple moving average 1.3424, dengan support yang lebih dalam berada di 1.3397 dan 1.3392, di mana garis tren sebelumnya kini memperkuat struktur bullish yang lebih luas.
(Analisis teknikal dalam artikel ini ditulis dengan bantuan alat AI. Ketahui lebih lanjut.)
Harga Pound Sterling Minggu Ini
Tabel di bawah ini menunjukkan perubahan persentase British Pound (GBP) terhadap mata uang utama yang tercantum minggu ini. British Pound merupakan yang terkuat terhadap Swiss Franc.
| USD | EUR | GBP | JPY | CAD | AUD | NZD | CHF | |
|---|---|---|---|---|---|---|---|---|
| USD | 0.50% | 0.43% | 0.64% | 0.52% | -0.30% | 0.65% | 0.66% | |
| EUR | -0.50% | -0.06% | 0.04% | 0.02% | -0.79% | 0.14% | 0.16% | |
| GBP | -0.43% | 0.06% | 0.02% | 0.09% | -0.72% | 0.21% | 0.23% | |
| JPY | -0.64% | -0.04% | -0.02% | -0.06% | -0.86% | 0.10% | 0.10% | |
| CAD | -0.52% | -0.02% | -0.09% | 0.06% | -0.77% | 0.16% | 0.15% | |
| AUD | 0.30% | 0.79% | 0.72% | 0.86% | 0.77% | 0.94% | 0.95% | |
| NZD | -0.65% | -0.14% | -0.21% | -0.10% | -0.16% | -0.94% | 0.02% | |
| CHF | -0.66% | -0.16% | -0.23% | -0.10% | -0.15% | -0.95% | -0.02% |
Peta panas menunjukkan perubahan persentase mata uang utama satu sama lain. Mata uang dasar dipilih dari kolom kiri, sementara mata uang kuotasi dipilih dari baris atas. Sebagai contoh, jika Anda memilih British Pound dari kolom kiri dan bergerak sepanjang garis horizontal ke US Dollar, perubahan persentase yang ditampilkan dalam kotak akan merepresentasikan GBP (dasar)/USD (kuotasi).
Top Articles
1Rupee India: Intervensi RBI Batasi Pelemahan terhadap Dolar AS - DBS2Prakiraan Harga GBP/JPY: Pelaku Pasar Optimistis Uji Momentum Pemulihan di Bawah Rata-Rata Bergerak Utama3Krone Norwegia: Prospek NOK lebih kuat hingga 2027 – Nordea4Ueda dari BoJ Isyaratkan Kenaikan Suku Bunga Lanjutan Seiring Inflasi Mendasar Mendekati 2%5Dolar Singapura: Prospek penguatan terhadap Dolar AS membaik - OCBC6Pound Inggris: Ketahanan ekonomi Inggris menopang Sterling terhadap Euro - Commerzbank7Yen Jepang sulit menguat meski Dolar AS melemah8Dolar AS: Fokus pada AI Kaburkan Arah Kebijakan The Fed – MUFG9Pound Inggris menyentuh level tertinggi dalam tiga pekan di dekat 1,3350 seiring dolar AS anjlok
KUOTASI LANGSUNG

SEMUA TENTANG FOREX
Mulai Sekarang!
Daftar dan akses Pasar Global dalam waktu kurang dari 3 menit

Terhubung dengan Kami












Informasi yang disediakan di situs web ini hanya bersifat umum dan bukan merupakan nasihat keuangan pribadi. Sebelum bertindak berdasarkan informasi apa pun di situs web ini, Anda harus mempertimbangkan kesesuaian informasi tersebut dengan tujuan, situasi keuangan, dan kebutuhan Anda. Berinvestasi dalam CFD dan Kontrak Margin FX mengandung risiko yang signifikan dan tidak cocok untuk semua investor. Anda dapat kehilangan lebih dari setoran awal Anda. Anda tidak memiliki, atau mempunyai, kepentingan apa pun atas aset acuan. Kami menyarankan agar Anda mencari nasihat independen dan memastikan bahwa Anda sepenuhnya memahami risiko yang terlibat sebelum melakukan trading. Penting bagi Anda untuk membaca dan mempertimbangkan dokumen pengungkapan sebelum Anda memperoleh produk apa pun yang tercantum di situs web ini. Informasi dan iklan yang ditawarkan di situs web ini tidak ditujukan untuk digunakan oleh siapa pun di negara atau yurisdiksi mana pun jika penggunaan tersebut bertentangan dengan hukum dan peraturan setempat. Produk dan Layanan yang ditawarkan di situs web ini tidak ditujukan bagi penduduk Amerika Serikat, Malaysia, dan Thailand.
TMGM diotorisasi dan diatur di berbagai yurisdiksi.
Trademax Australia Limited, yang beroperasi sebagai TMGM, diatur oleh Australian Securities and Investments Commission (ASIC), AFSL no. 436416 dan berlokasi di Level 28, One International Tower, 100 Barangaroo Avenue, 2000 Sydney, NSW Australia.
Email: [email protected]
Trademax Global Limited, yang beroperasi sebagai TMGM, diotorisasi dan diatur oleh Vanuatu Financial Services Commission (VFSC), nomor registrasi 40356 dan terdaftar di 1276, Kumul Highway, Port Vila, Vanuatu, Republic of Vanuatu.
Email: [email protected]
Trademax Global Markets (SE) Limited, berdagang sebagai TMGM, diberi wewenang dan diatur oleh Financial Services Authority (FSA) Seychelles dengan nomor lisensi SD224. Perusahaan terdaftar di Kantor No. 13, Providence Estate ABIS Centre, Mahe, Seychelles.
Email: [email protected]
Trademax Global Markets (International) Pty Ltd, yang beroperasi sebagai TMGM, diotorisasi dan diatur oleh Financial Services Commission, Mauritius (FSC) dengan lisensi no. GB22201012, dan terdaftar di 33, Edith Cavell Street C/o IQ EQ Fund Services (Mauritius) Ltd Port Louis, 11324 Mauritius.
Email: [email protected]
Hak Cipta © TMGM. Semua hak dilindungi