

The chip rout is funding the Dow Jones Industrial Average's record chase
- DJIA adds close to 700 points to trade just short of 52,900, roughly 450 points beneath the record set in the first week of July.
- Healthcare and financials reach record highs while the technology sector sits at its lowest level since early May, so the money in motion is not money leaving.
- Both conditions the rotation depends on, cheaper energy and a rate curve that stays put, get tested inside 48 hours.
The Dow Jones Industrial Average trades just short of 52,900 on Tuesday, higher by close to 700 points and 1.3%, roughly 450 points beneath the record it set in the first week of July. Taken alone, that reads as a broad risk rally. One index over, the semiconductor complex is in a drawdown that has taken more than 20% out of the sector this month, and Korea's benchmark tripped its ninth circuit breaker of the year overnight on a fall of nearly 11%.

The selling has a destination
Nine of the eleven S&P 500 sectors trade higher on the session. Healthcare and financials both reach record highs, led by insurers, while consumer staples add close to 4% on the strength of a single earnings report. The technology sector, on the same tape, sits at its lowest level since the first week of May.
That is not a market selling off but a market changing seats. Cash exiting the names that carried the tape to records has to arrive somewhere, and it is arriving in exactly the old-economy exposure the Dow Jones Industrial Average is built out of. The leap is real. A good part of it is also borrowed.
An index that cannot feel the rout
Price weighting converts a pair of earnings beats into an outsized number of index points. Sherwin-Williams (SHW) adds 8% on a second-quarter beat and a raised full-year outlook, and as one of the highest-priced names in the thirty it pulls more index points behind it than any equal-weighted structure would grant. Coca-Cola (KO) adds 5% on a beat at both lines with guidance lifted alongside it.
Micron (MU) falls about 9% and Advanced Micro Devices (AMD) about 6% in the same session, and neither costs the index a single point, because neither is a member. Nvidia (NVDA) is the only chipmaker in the thirty, and the largest names in that complex have been handled far more gently this month than memory and equipment makers down 20% to 40%. What the benchmark does not carry matters more than what it does.
Software supplies the rest of the lift, with Microsoft (MSFT) adding 2% and Salesforce (CRM) 5%, both of them members, while Apple (AAPL) leads through a five trillion Dollar market value ahead of its own results later this week. The composition that made this index look sluggish through two years of an artificial intelligence melt-up is the composition paying now.
Two conditions, both tested inside 48 hours
The rotation into cyclical and rate-sensitive exposure runs on two things, cheaper energy and a rate curve that does not shift higher. Crude Oil is delivering on the first, with West Texas Intermediate roughly 5% lower near $78.00 and Brent just below $84.00, a decline driven by diplomacy rather than by barrels.
Iran's foreign ministry held separate calls with its Saudi and Omani counterparts on the Strait of Hormuz, and Muscat has reportedly put a Gulf-backed plan in front of Tehran built on voluntary transit contributions rather than tolls imposed by Iran. Trump publicly credits the exchanges as productive, while Tehran denies that any direct negotiation with Washington is under way. Verified transits through the Strait ran to fewer than 30 across the entire weekend, against roughly 100 vessels a day before the war.
The second condition gets its answer at 18:00 GMT on Wednesday. A hold at 3.75% is the base case, with futures pricing the July increase near one in three and cumulative odds of at least one hike by the September meeting close to 80%. Four de-escalations since April have bought equity index points and no relief whatsoever at the front end of the curve.
The week's real tests
Wednesday's statement lands at 18:00 GMT with the press conference at 18:30 GMT. Forward guidance has been struck from the statement, so the vote tally carries the message, and a hold arriving with dissents reads nothing like the unanimous hold delivered in June.
Thursday at 12:30 GMT brings the June Personal Consumption Expenditures price data, the headline gauge seen at -0.1% MoM and 3.7% YoY from 4.1%, with the core measure at 0.2% MoM and 3.3% YoY. Second-quarter Gross Domestic Product arrives in the same window at 2.1% annualized, alongside initial jobless claims seen at 200K against 187K.
Friday fills in the wage and survey side, with the second-quarter Employment Cost Index at 0.8%, the Chicago purchasing managers index at 56 and Michigan sentiment at 54. The one-year inflation expectation is seen unchanged at 4.2%, and that is the figure deciding whether this month's energy relief has reached the household yet.
Levels and bias
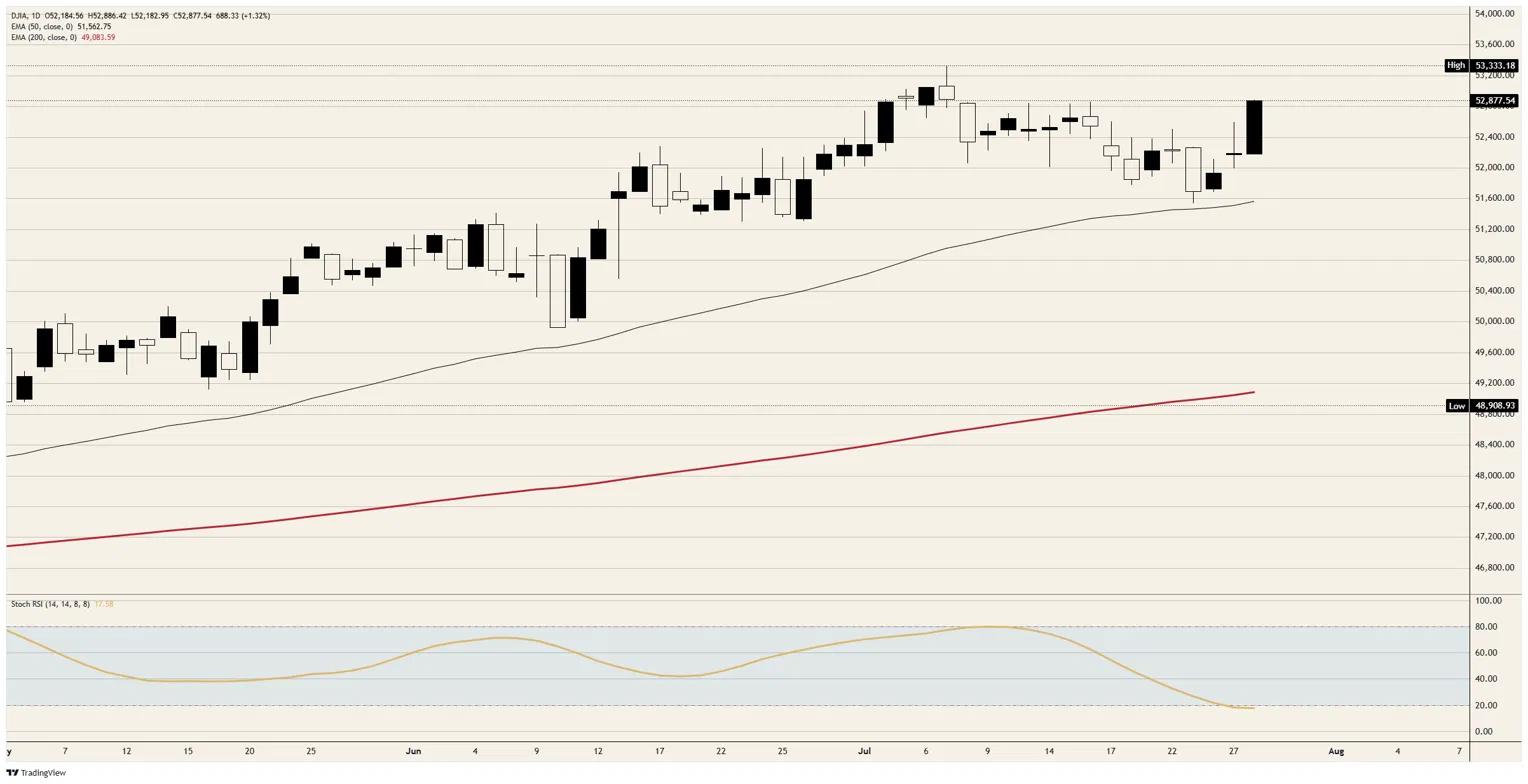
Resistance: The session high just short of 52,900 is the immediate line, and clearing it opens the 53,000 handle with the record just above 53,300 as the objective beyond.
Support: The 52,600 area is the first shelf beneath spot, then the 52,200 area carrying both the session low and Monday's close. The 52,000 handle sits under that, with the 50-day Exponential Moving Average near 51,600 the trend defence of last resort.
Bias: Bullish above the 52,600 area, objective the record just above 53,300, invalidation on a daily close back beneath 52,200. The daily Stochastic Relative Strength Index near 20 is describing the range the index just left rather than the breakout it is making, while the five-minute reading above 90 puts the stretch squarely intraday, so the near-term risk is a pause and not a reversal.
Dow Jones daily chart
Dow Jones FAQs
The Dow Jones Industrial Average, one of the oldest stock market indices in the world, is compiled of the 30 most traded stocks in the US. The index is price-weighted rather than weighted by capitalization. It is calculated by summing the prices of the constituent stocks and dividing them by a factor, currently 0.152. The index was founded by Charles Dow, who also founded the Wall Street Journal. In later years it has been criticized for not being broadly representative enough because it only tracks 30 conglomerates, unlike broader indices such as the S&P 500.
Many different factors drive the Dow Jones Industrial Average (DJIA). The aggregate performance of the component companies revealed in quarterly company earnings reports is the main one. US and global macroeconomic data also contributes as it impacts on investor sentiment. The level of interest rates, set by the Federal Reserve (Fed), also influences the DJIA as it affects the cost of credit, on which many corporations are heavily reliant. Therefore, inflation can be a major driver as well as other metrics which impact the Fed decisions.
Dow Theory is a method for identifying the primary trend of the stock market developed by Charles Dow. A key step is to compare the direction of the Dow Jones Industrial Average (DJIA) and the Dow Jones Transportation Average (DJTA) and only follow trends where both are moving in the same direction. Volume is a confirmatory criteria. The theory uses elements of peak and trough analysis. Dow’s theory posits three trend phases: accumulation, when smart money starts buying or selling; public participation, when the wider public joins in; and distribution, when the smart money exits.
There are a number of ways to trade the DJIA. One is to use ETFs which allow investors to trade the DJIA as a single security, rather than having to buy shares in all 30 constituent companies. A leading example is the SPDR Dow Jones Industrial Average ETF (DIA). DJIA futures contracts enable traders to speculate on the future value of the index and Options provide the right, but not the obligation, to buy or sell the index at a predetermined price in the future. Mutual funds enable investors to buy a share of a diversified portfolio of DJIA stocks thus providing exposure to the overall index.













