Pi Network Price Forecast: Bullish RSI divergence adds to rebound odds
Oleh Vishal Dixit
Diperbarui: 29 Jul 2026


ARTIKEL POPULER

Pi Network (PI) holds steady above $0.0700 at press time on Wednesday, following a nearly 20% decline over the last seven days. PI faces firm selling pressure despite ongoing liquidity pool testing, including SLICE and Test-Pi tokens on Pi Launchpad.
- Pi Network stabilizes above $0.0700 on Wednesday, following a roughly 20% decline over the last seven days.
- Pi Launchpad tests liquidity pool containing SLICE and Test-Pi tokens.
- The technical outlook for PI is mixed, with bullish RSI divergence suggesting early signs of a rebound.
Pi Network (PI) holds steady above $0.0700 at press time on Wednesday, following a nearly 20% decline over the last seven days. PI faces firm selling pressure despite ongoing liquidity pool testing, including SLICE and Test-Pi tokens on Pi Launchpad. The technical outlook for PI is mixed, with the Relative Strength Index (RSI) suggesting early signs of a near-term rebound amid a long-term bearish trend.
Mild recovery in PI social volume amid Launchpad testing
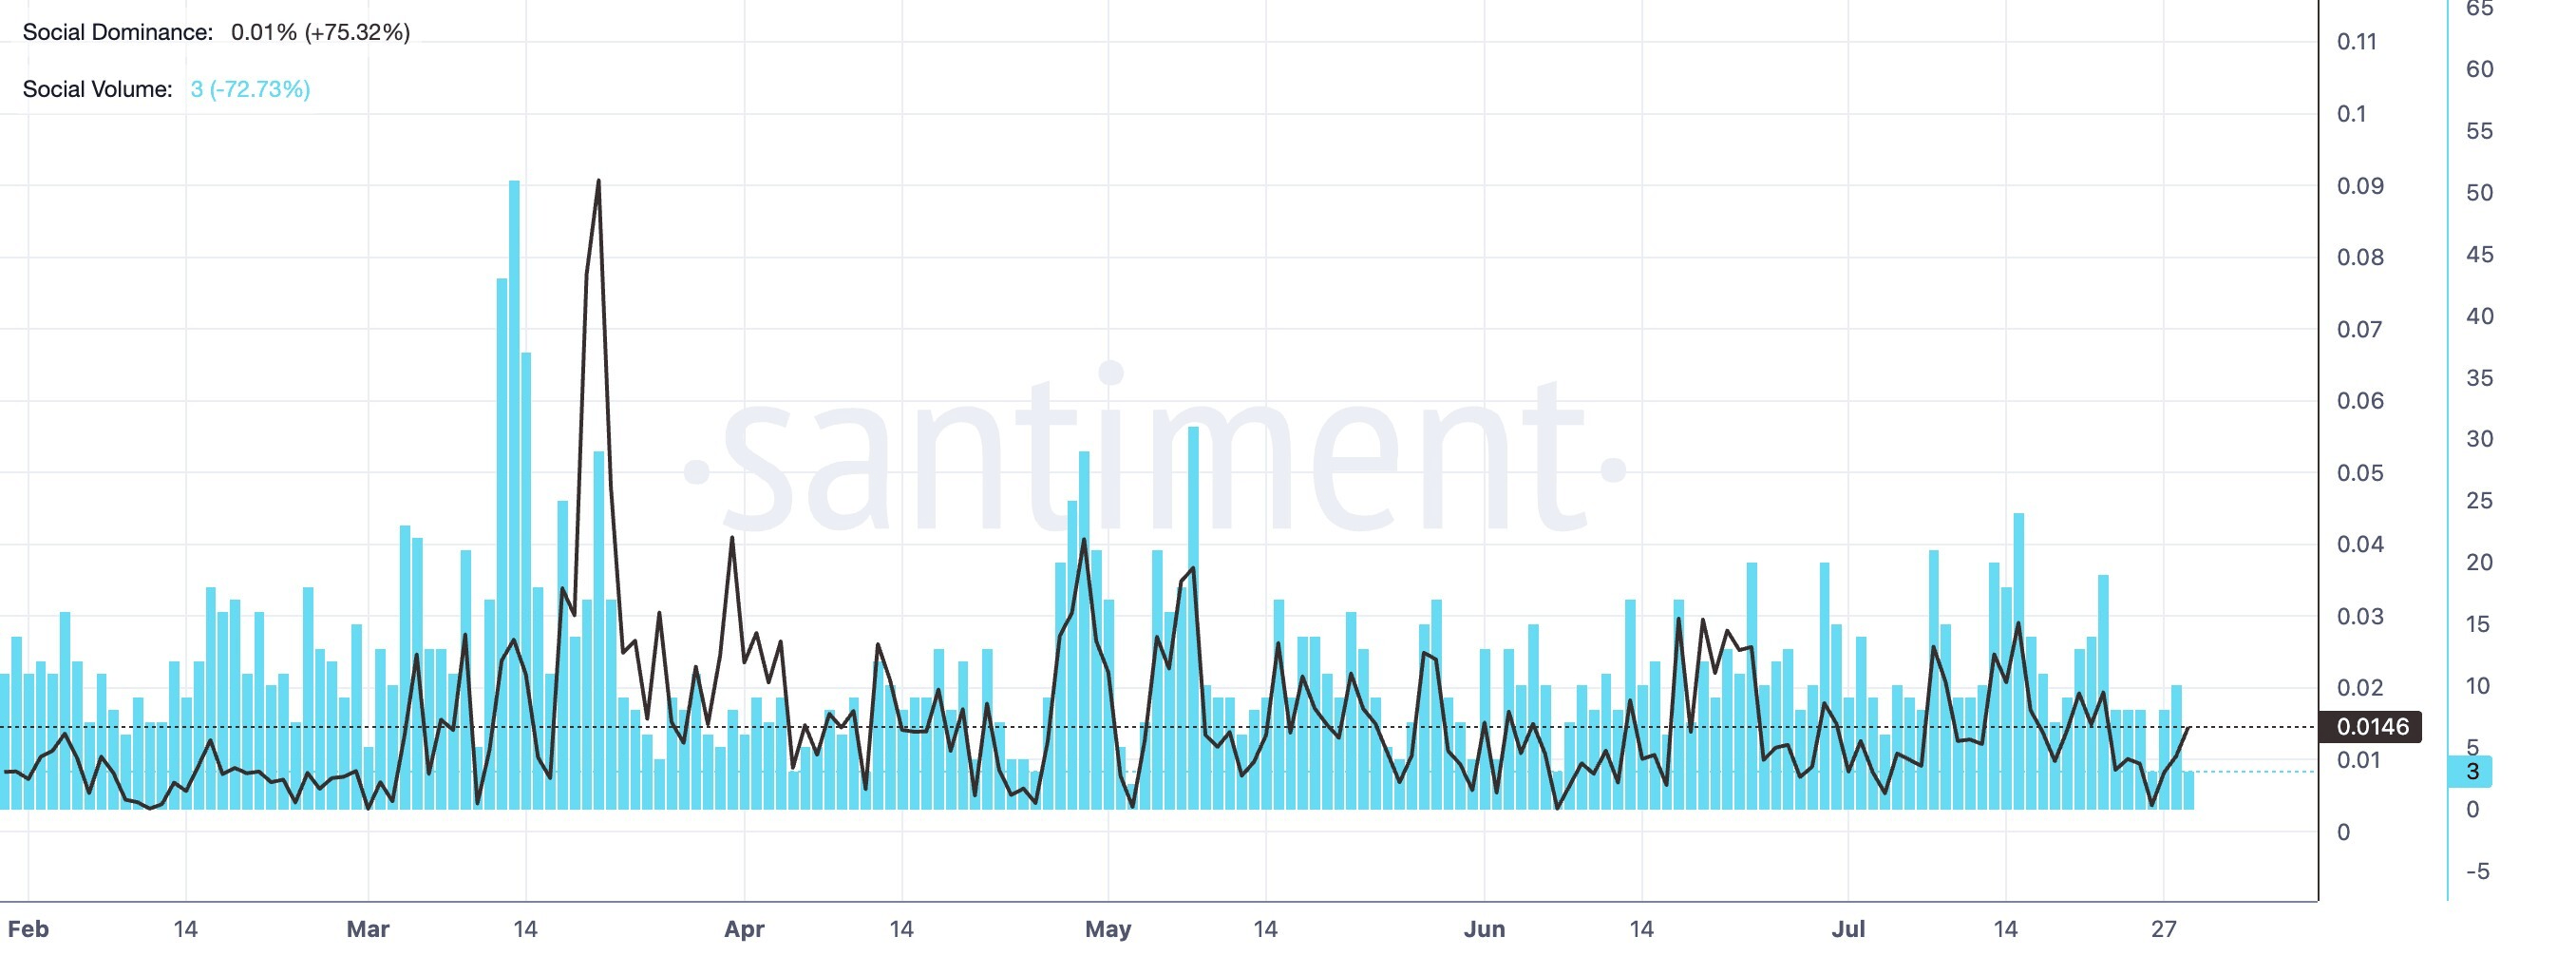
Pi Network experiences a mild recovery in social interest amid the ongoing liquidity pool testing on Pi Launchpad. Santiment data shows that the PI social volume and dominance are up to 10% and 0.01%, from 3% and 0.003% on Sunday, respectively.
On the other hand, Pi Network announced the launch of the SLICE and Test-Pi tokens liquidity pool on the testnet, which uses an automated market maker algorithm to calculate swaps based on the amounts of both assets in the pool. This marks a step toward expansion of the DeFi ecosystem of the Pi Network.
Technical outlook: Will Pi Network rebound?
Pi Network retains a bearish near-term bias after the recent 20% downside move over the last seven days, within a parallel bearish channel on the daily chart. Still, PI hovers around the day’s open, following a Hammer Candle formation the previous day, suggesting near-term indecision after an extended slide.
The Moving Average Convergence Divergence (MACD) holds marginally above the signal line as buying pressure wanes, while the Relative Strength Index (RSI) lingers near the oversold band around 30. That said, the RSI is at a higher level compared to the July 13 low, while price retests the same zone, projecting a bullish divergence.
A potential rebound in PI could test the 127.2% extension level, measured from $0.11998 to $0.1183, at $0.0961, which previously capped recovery on July 20. A sustained close above this level must clear the overhead trendline near the $0.1000 psychological threshold for a clear bullish reversal signal.
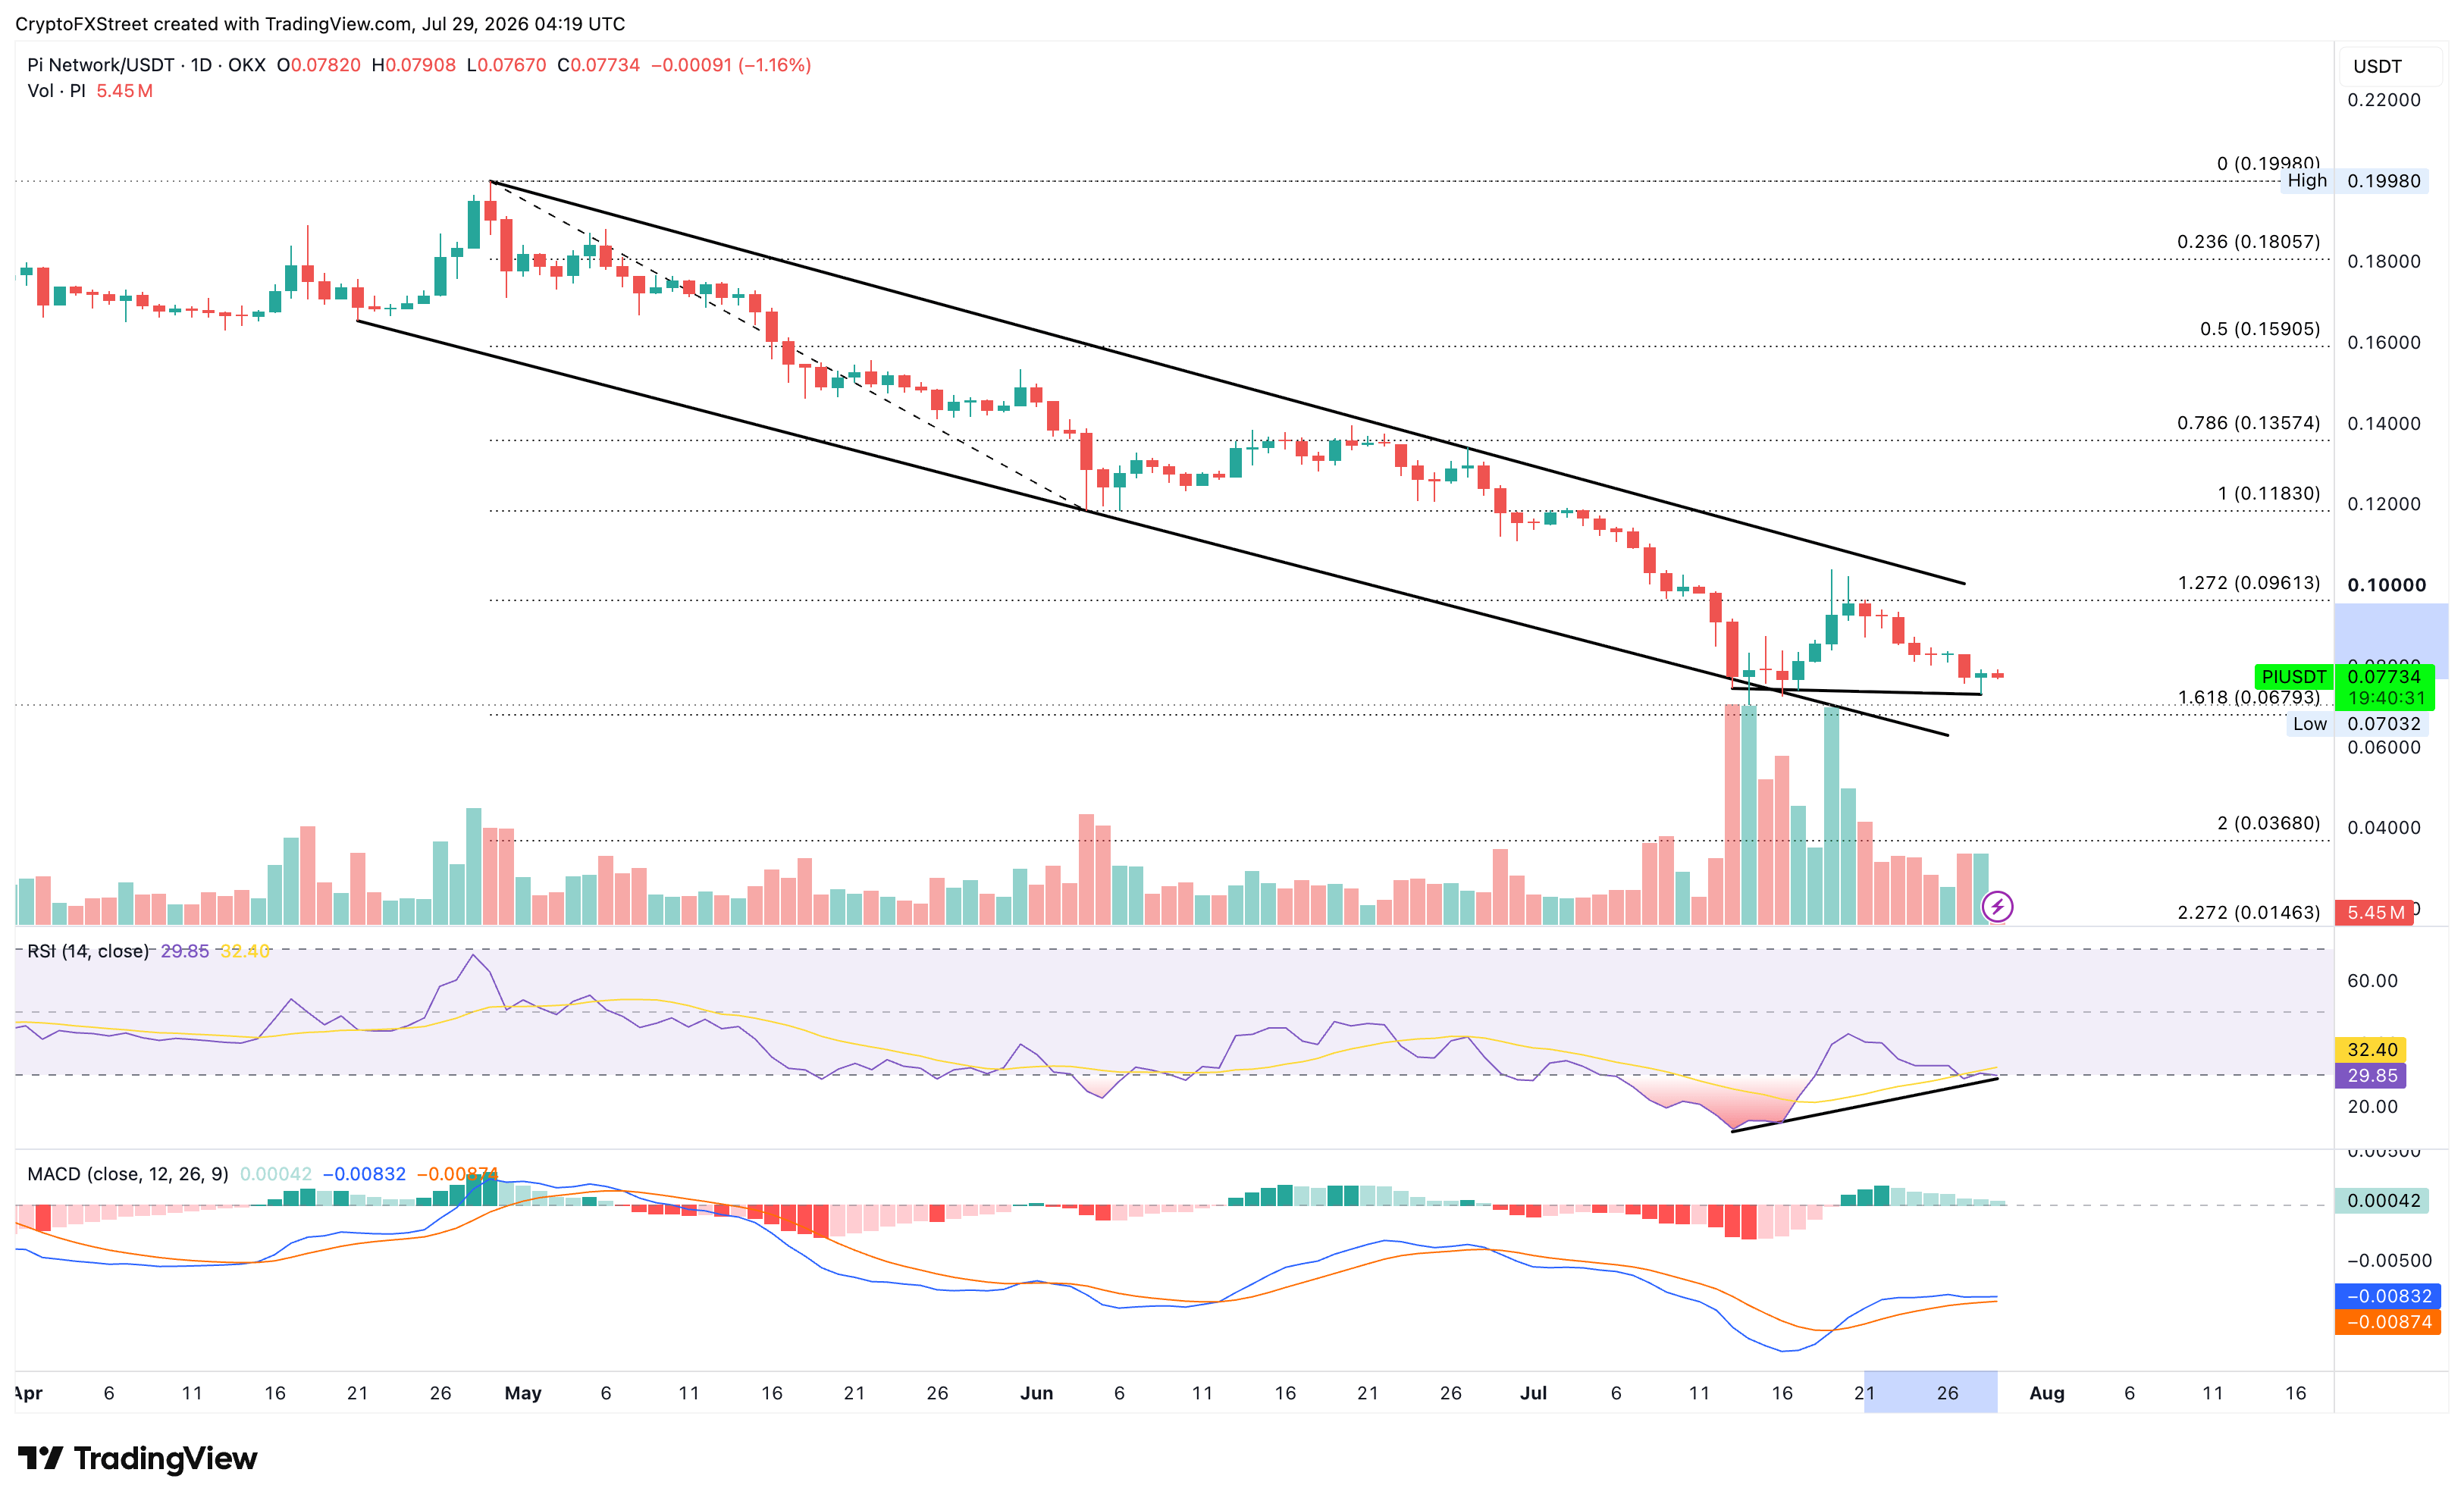
On the downside, immediate interest sits at the record low near $0.0700, reinforced by the 161.8% extension level at $0.0679. A daily close below this level would open the path toward a steeper decline.
(The technical analysis of this story was written with the help of an AI tool. Know more.)

Lebih dari satu juta pengguna mengandalkan FXStreet untuk data pasar real-time, alat charting, wawasan ahli, dan berita forex. Kalender ekonomi komprehensif dan webinar edukatif membantu trader tetap mendapat informasi dan membuat keputusan terukur. FXStreet memiliki sekitar 60 profesional yang tersebar antara kantor pusat Barcelona dan berbagai wilayah global.
Baca Selengkapnya