Ethereum Price Forecast: ETH cools ahead of Fed rate decision
Oleh Michael Ebiekutan
Diperbarui: 28 Jul 2026


ARTIKEL POPULER

Ethereum (ETH) is hovering near $1,900 on Tuesday as on-chain data suggests recent recovery sentiment has calmed ahead of the Federal Open Market Committee (FOMC) decision on interest rates.
- US sentiment in native ETH trading venues is declining, but ETH ETFs continue their recovery.
- Investors are moving ETH on-chain near break-even prices after the recovery earlier in the month.
- ETH bounces off the 20-day EMA after a rejection above the 100-day EMA.
Ethereum (ETH) is hovering near $1,900 on Tuesday as on-chain data suggests recent recovery sentiment has calmed ahead of the Federal Open Market Committee (FOMC) decision on interest rates.
US sentiment across ETH markets in exchanges declined over the past week as the Coinbase Premium Index dropped from -0.036 to -0.098, erasing some of the recovery in prior weeks and keeping the index in negative territory.
The Coinbase Premium Index measures the percentage price difference between the ETH/USDT pair on Coinbase Pro and Binance, serving as an indicator of market sentiment in the US relative to global native ETH trading venues.
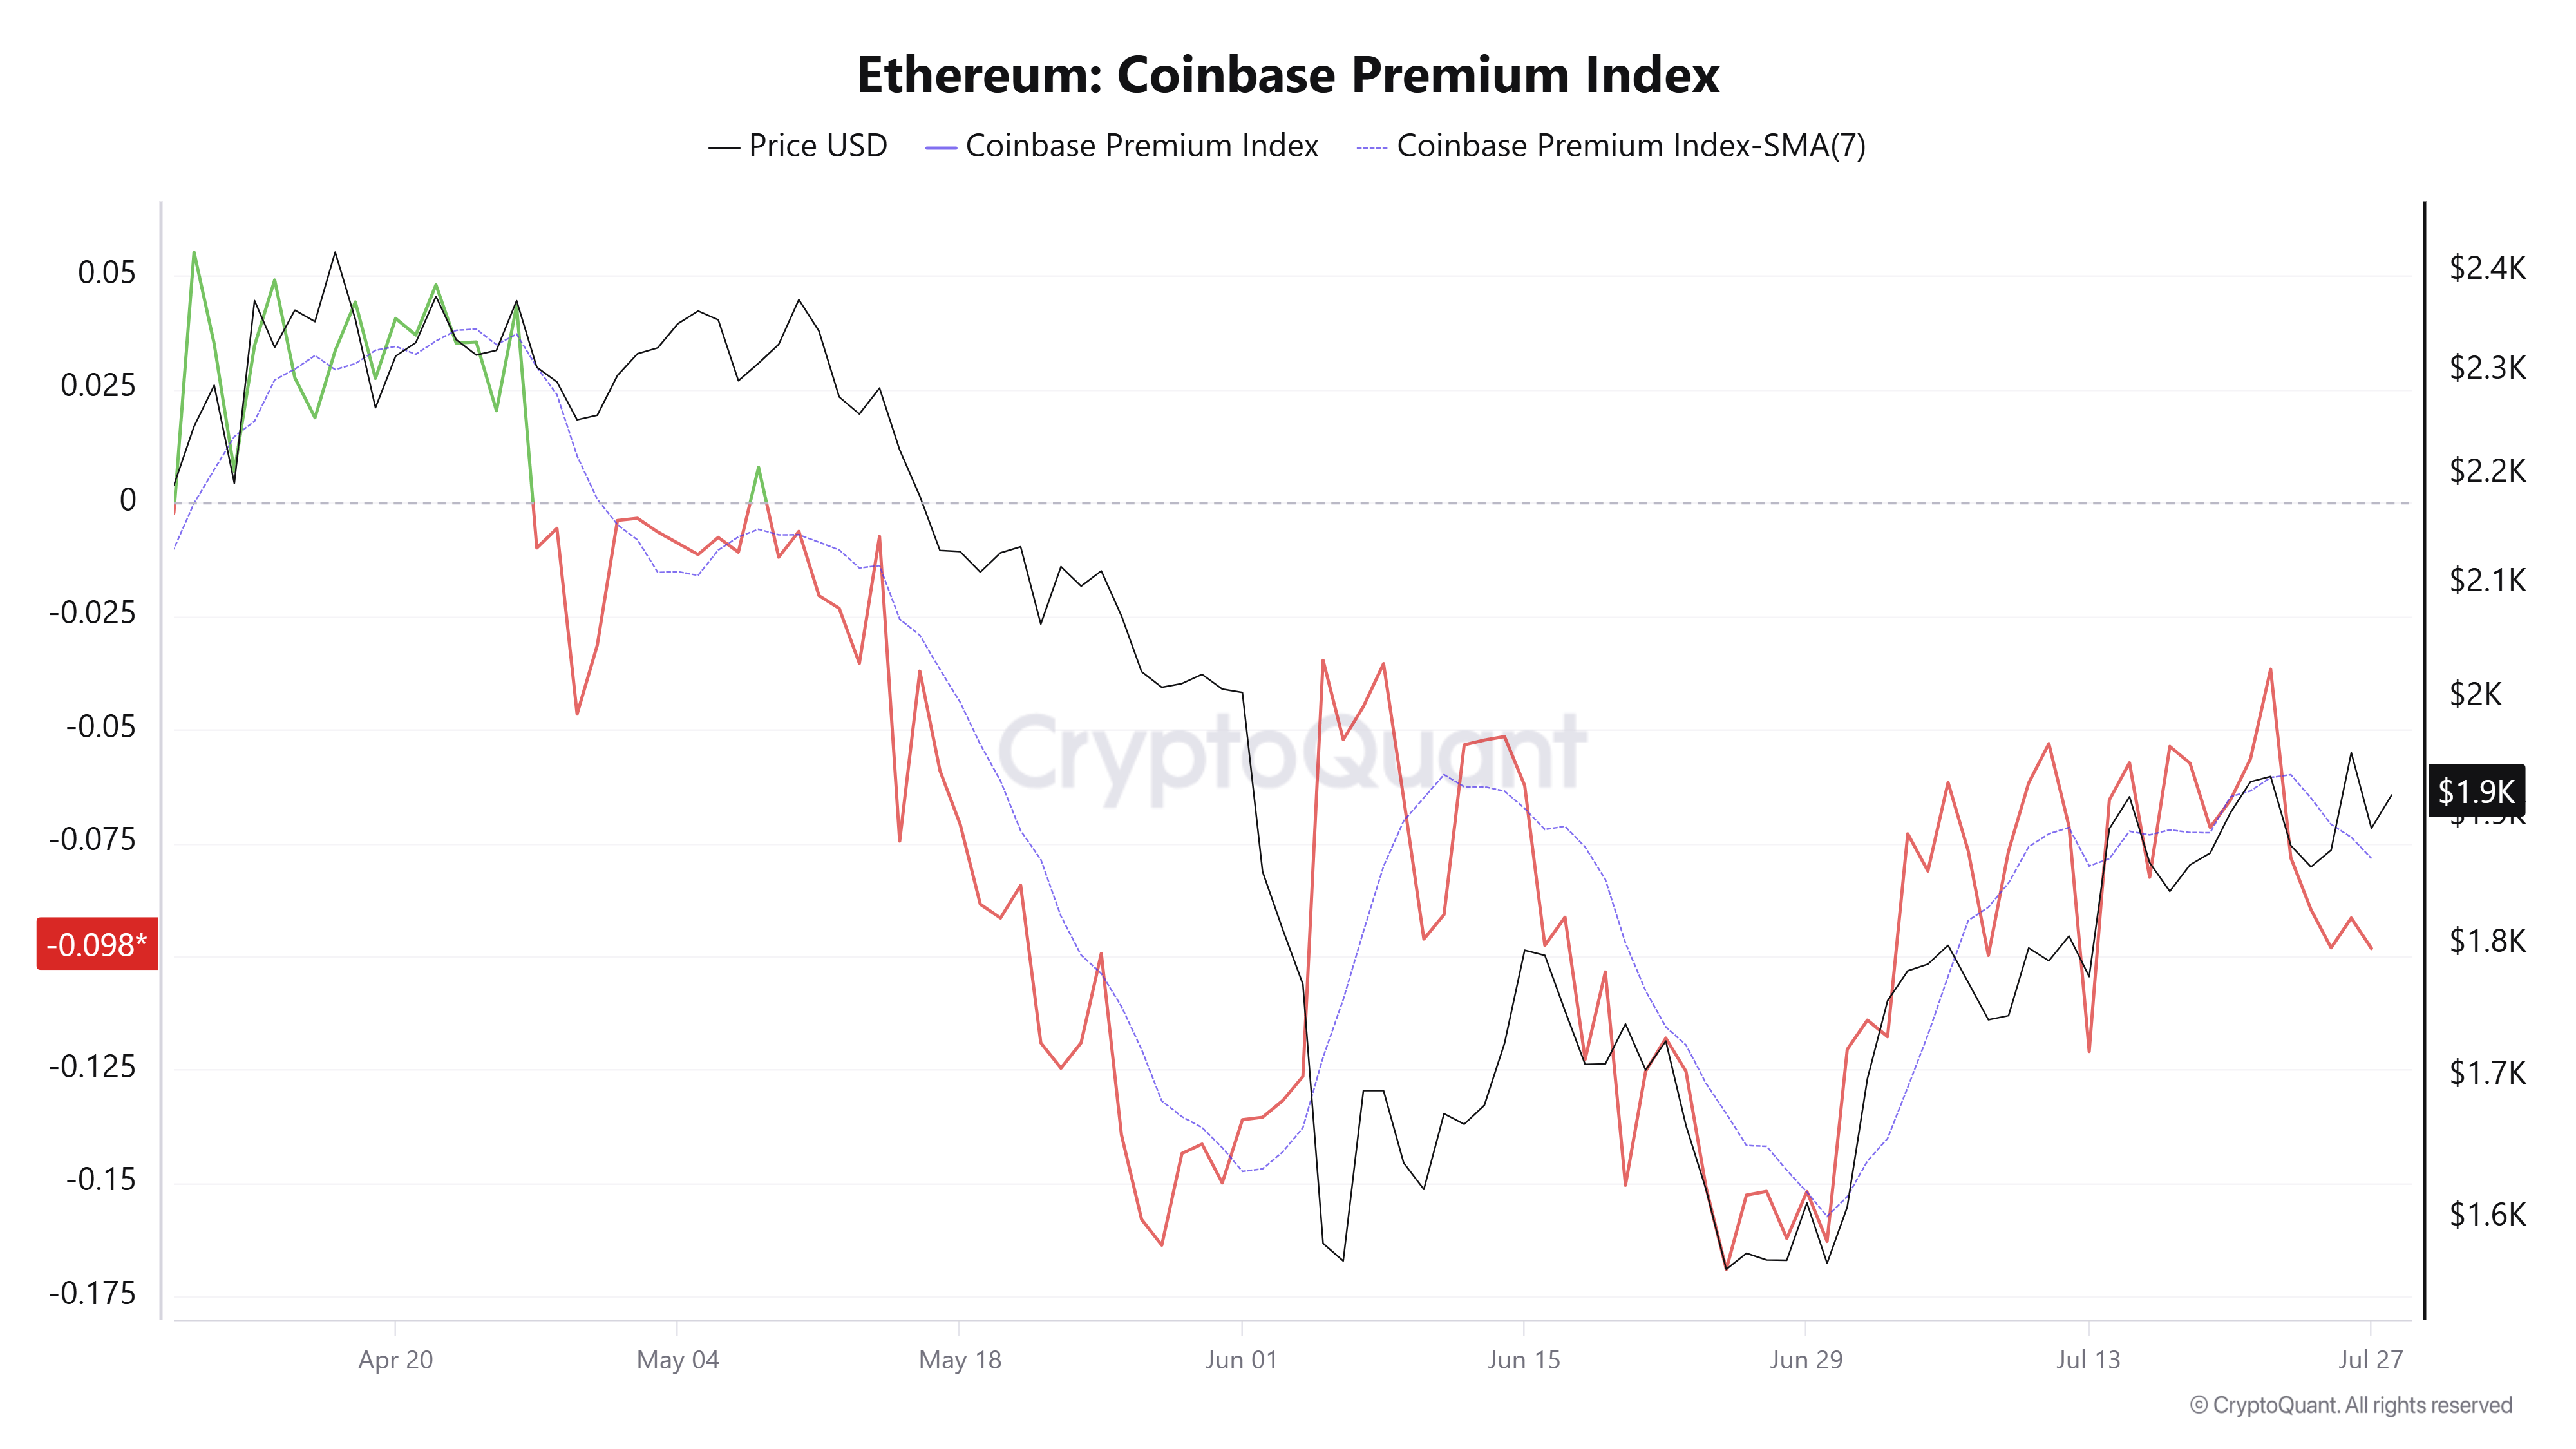
While sentiment remains weak in traditional crypto venues, US spot ETH exchange-traded funds (ETFs) have continued their recovery, with a third consecutive week of net inflows totaling $103.9 million last week, per SoSoValue data. On the daily timeframe, the products also returned to inflows, pulling in a modest $9.23 million on Monday after $70.62 million outflows last Friday.
Despite the inflows in ETH ETFs, the figures remain tiny compared to the heavy outflows they saw in the first half of the year.
Investors distribute near break-even prices ahead of FOMC decision
Generally, flows in and out of traditional crypto exchanges remained negative but have tilted slightly upward over the past week. The move indicates that while buying remains dominant, the pressure has begun to ease. Declining exchange net flows indicate dominant buying pressure, as funds flow out of exchanges, and vice versa for increasing flows.
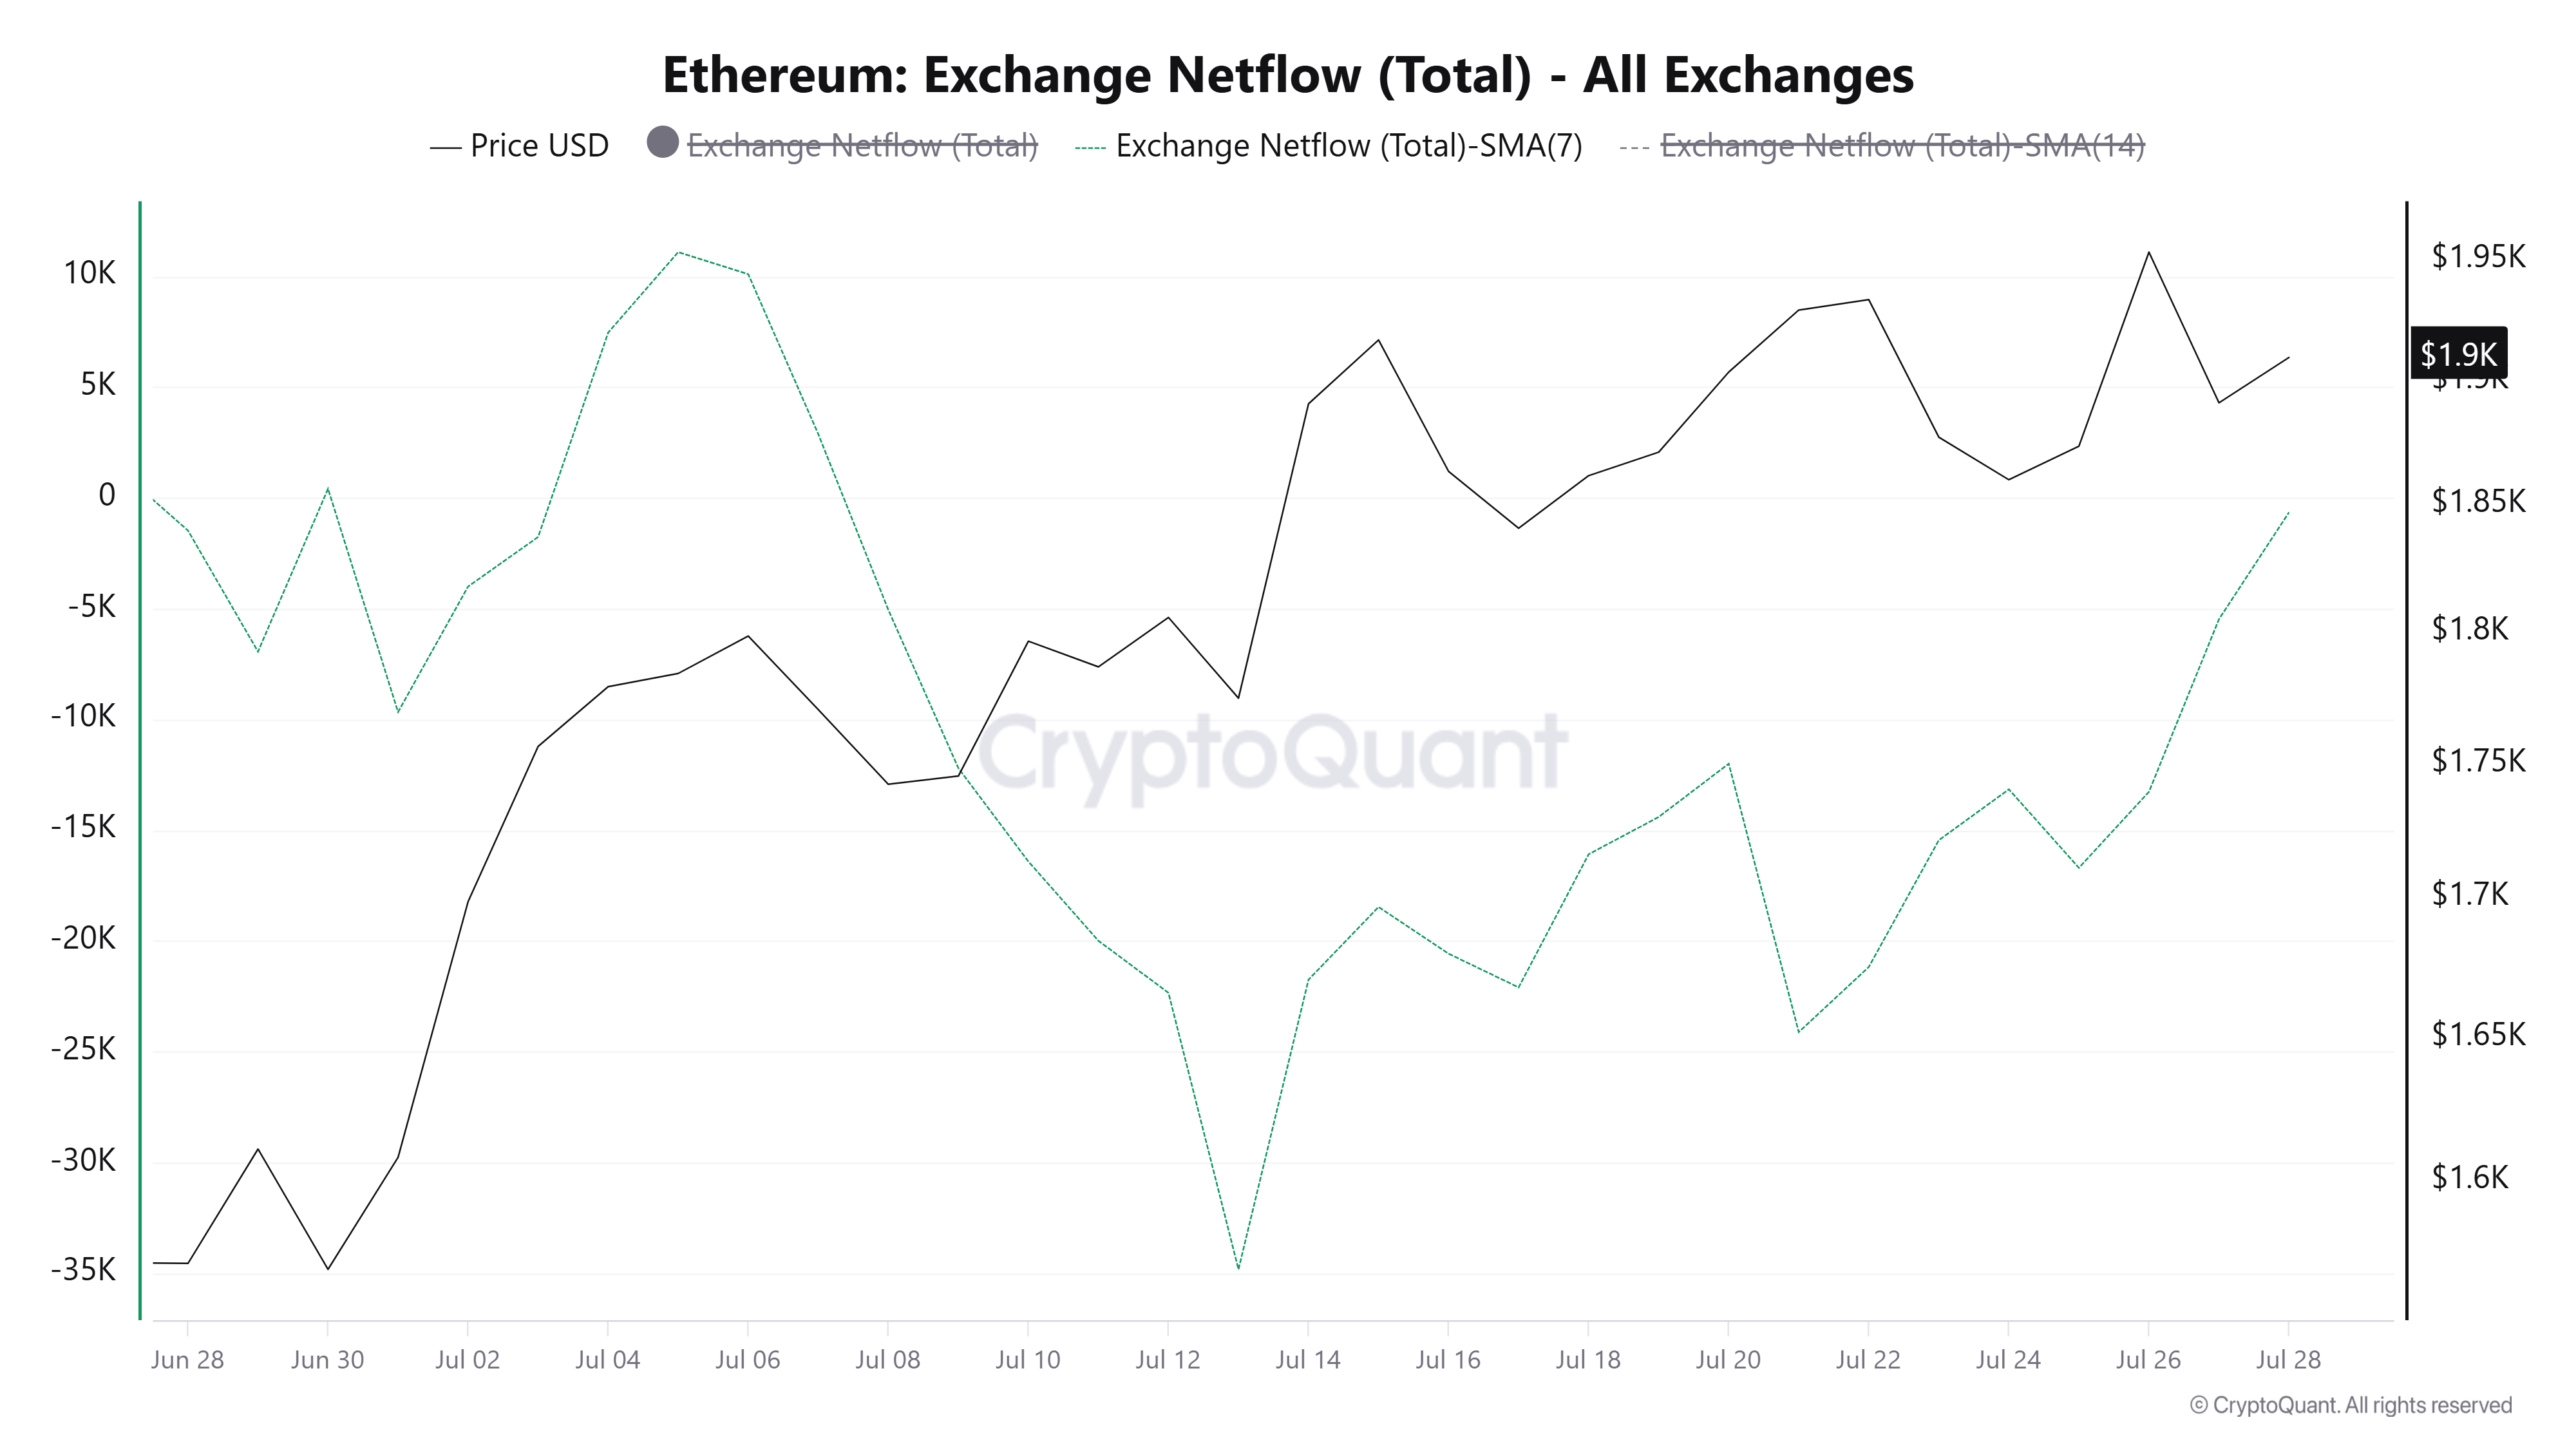
As prices rise, investors may be moving coins to exchanges. Most of these coins are being traded at modest losses, suggesting investors remain cautious and may be using the recent recovery to reduce losses.
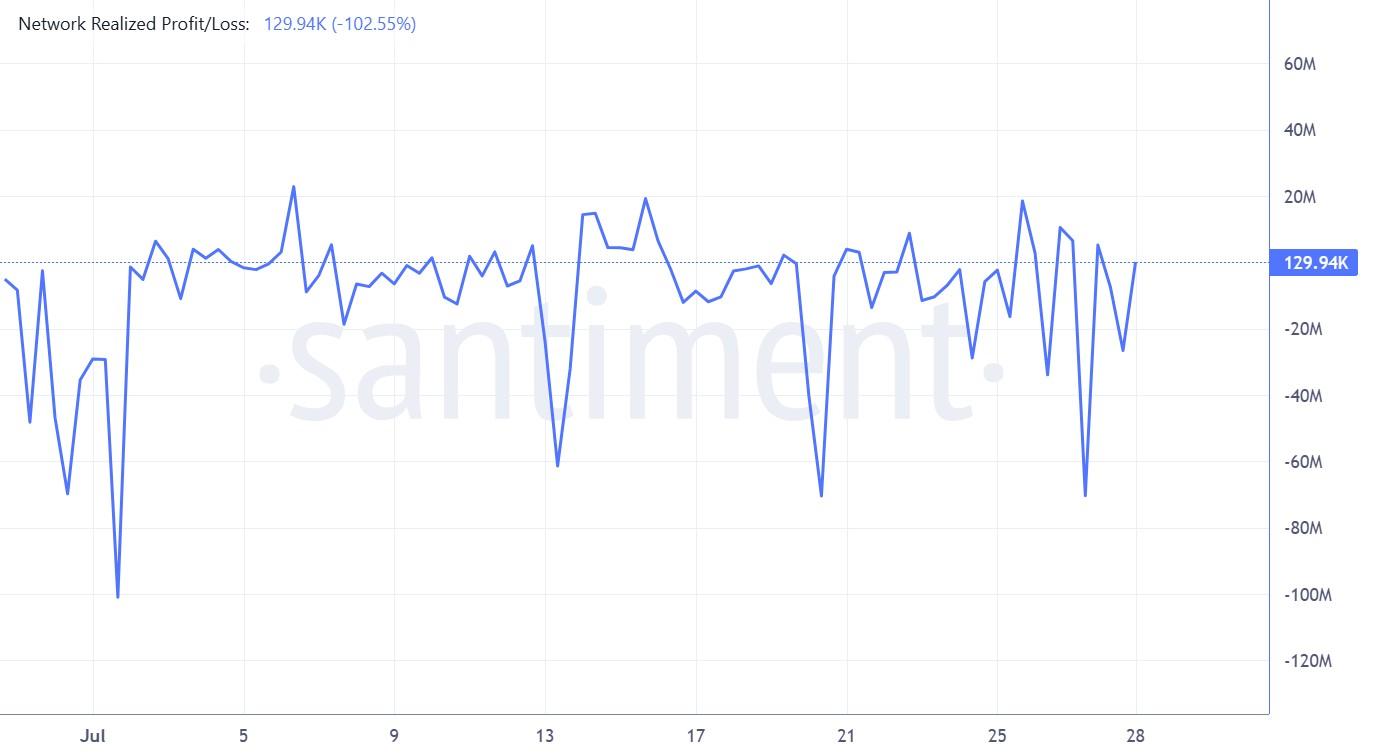
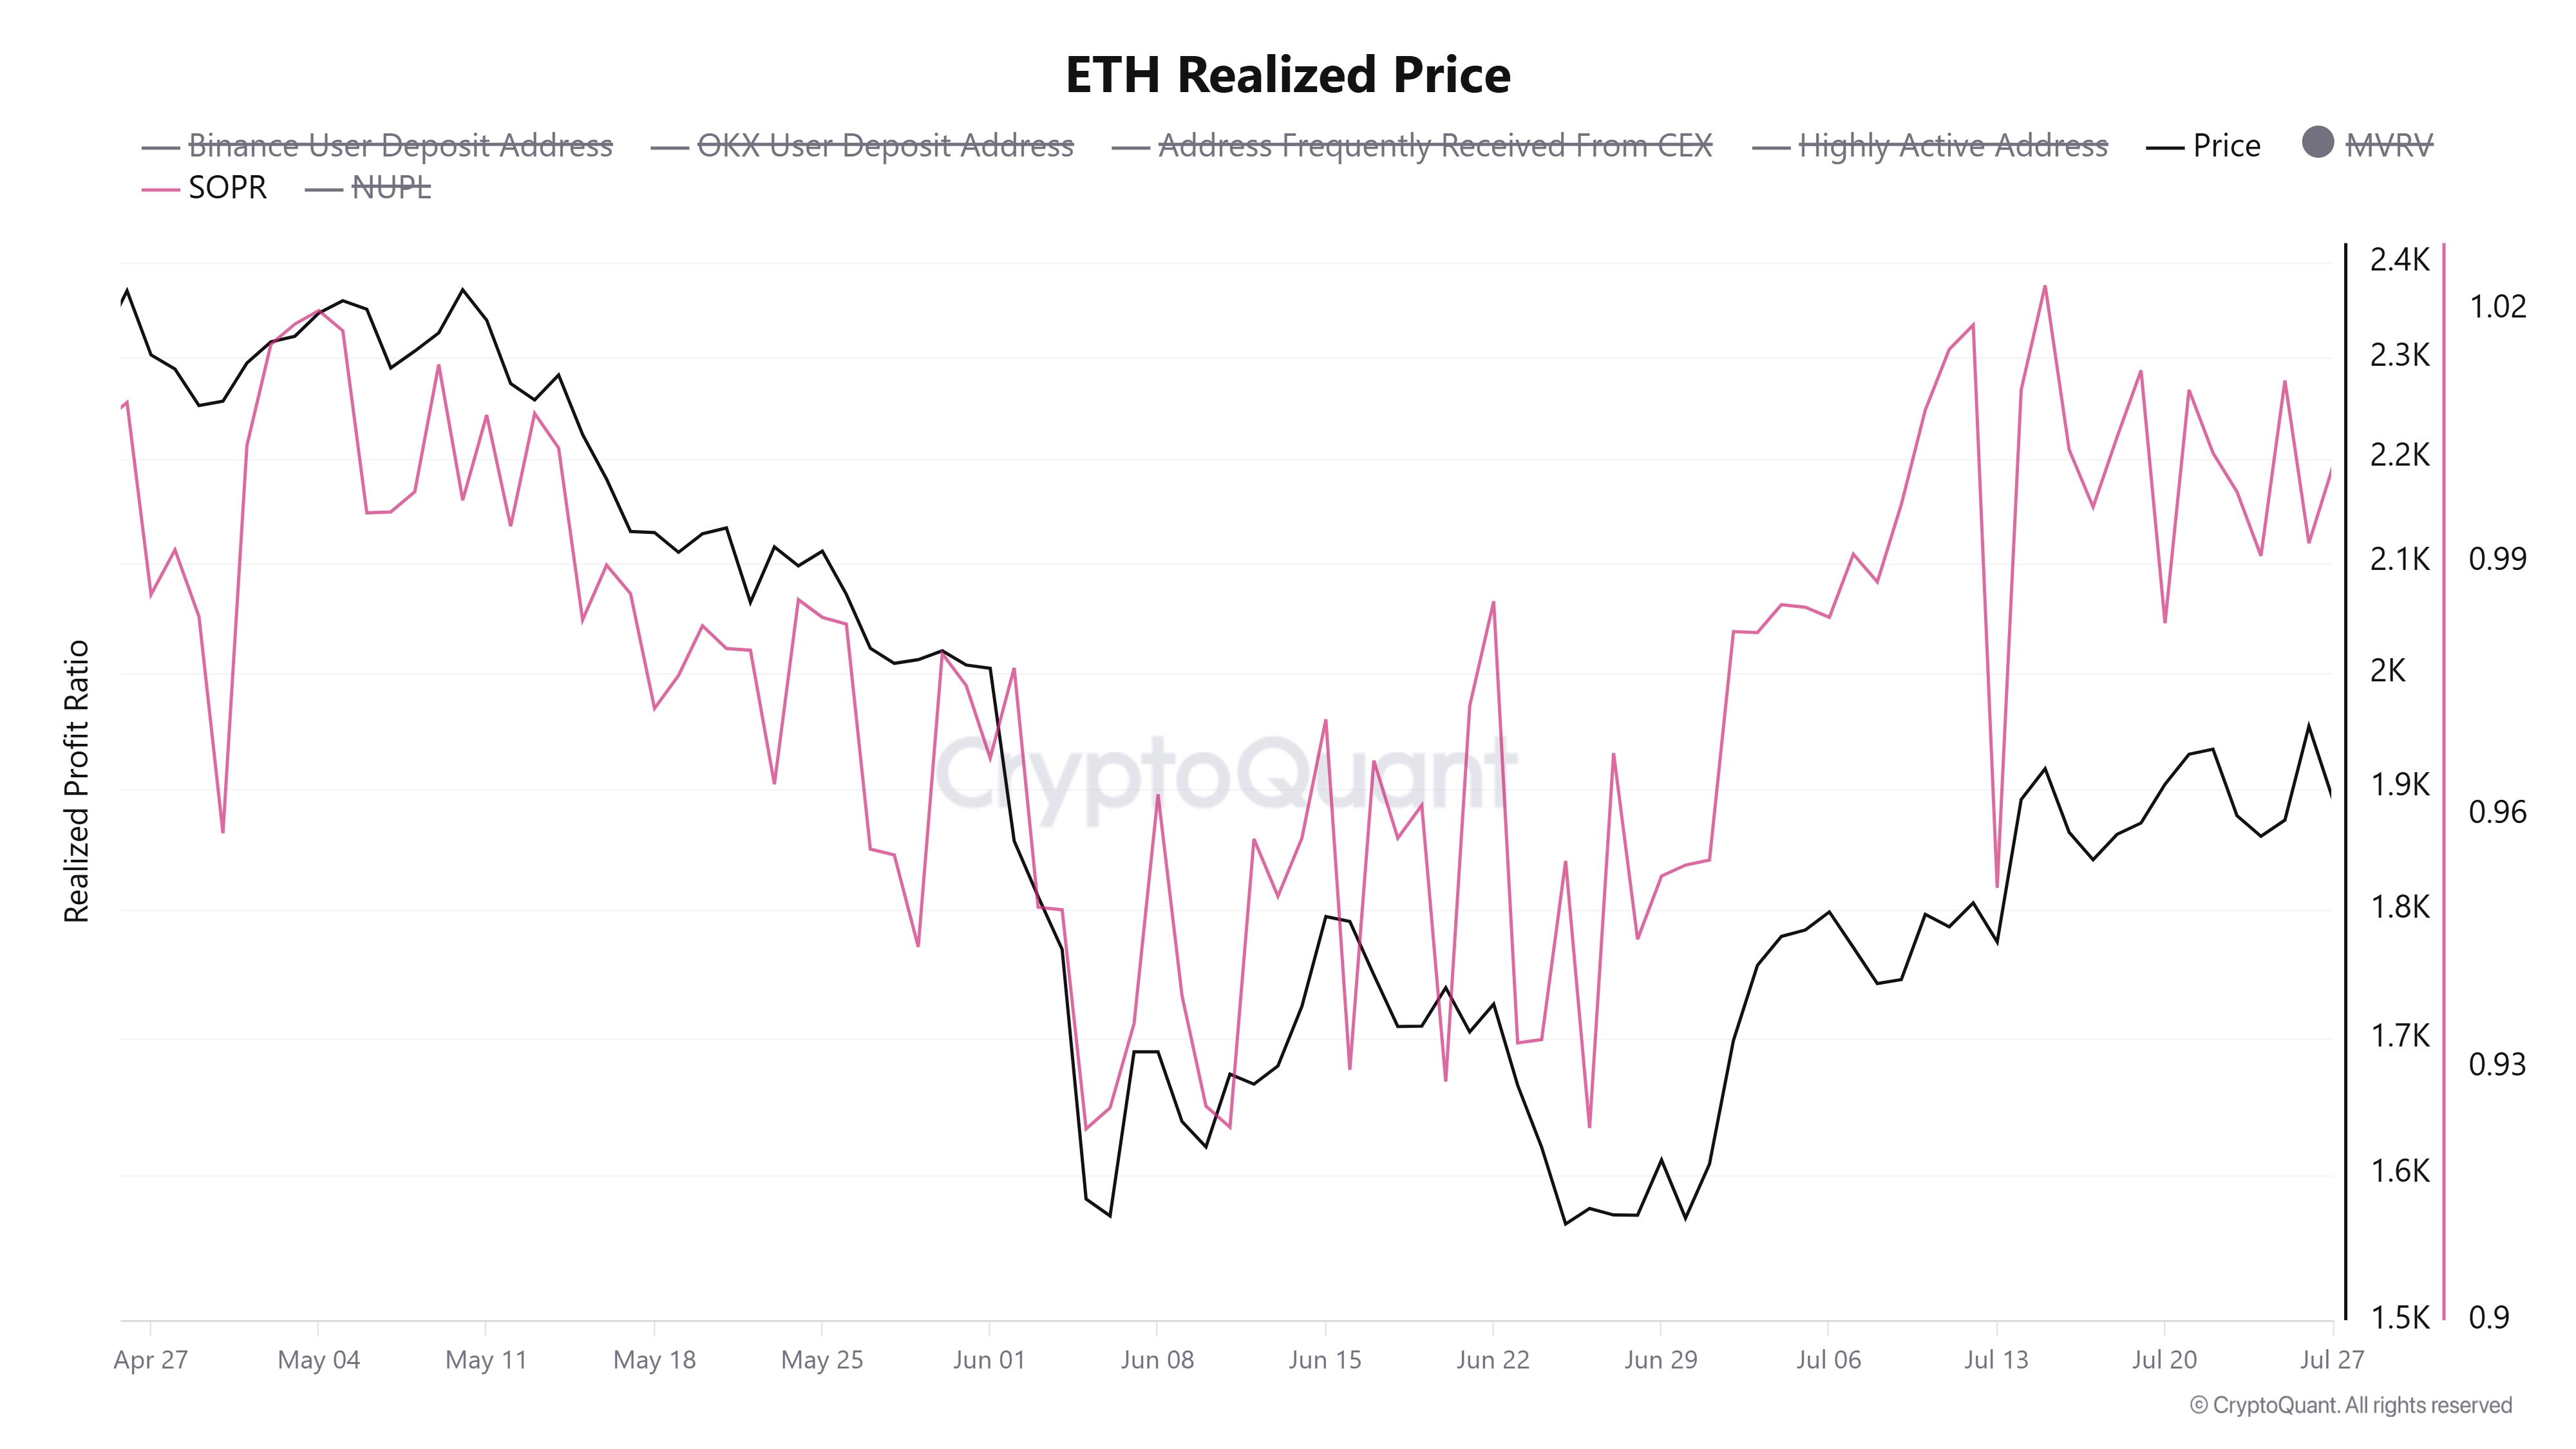
The Spent Output Profit Ratio (SOPR), which measures the profitability of distributed coins, paints a similar picture. The metric has been hovering between 0.99 and 1.01 over the past week, meaning most of the coins spent during the period are moving toward break-even prices.
A majority of these distributed coins are potentially flowing from retail wallets holding 100-1K ETH. The cohort scaled down their collective balance by 130K ETH over the past week, maintaining a distribution bias.
However, the holdings of wallets with larger balances, 10K-100K ETH and 1K-10K ETH, remained largely unchanged, reflecting a neutral sentiment.
The slowdown in the recent recovery and largely neutral sentiment across these on-chain metrics comes ahead of the FOMC's decision on interest rates on Wednesday. A 30% chance of a rate hike is increasing cautious sentiment across the market, with investors potentially moving to the sidelines until the outcome of tomorrow's meeting is known.
Ethereum Price Forecast: ETH bounces off 20-day EMA, retests 100-day EMA
Ethereum recorded $101.68 million in liquidations over the past 24 hours, led by $72.67 million in long liquidations.
On the daily chart, ETH maintains a constructive near-term bullish bias as it holds above the 20- and 50-day Exponential Moving Averages (EMAs) at $1,863 and $1,842, respectively and is only marginally below the 100-day EMA at $1,933, which now caps the topside.
Momentum remains supportive, with the 14-day Relative Strength Index (RSI) near 58 and the Stochastic Oscillator (Stoch) around 65, suggesting buyers still retain control without extreme overbought conditions.
On the downside, initial support is seen at the cluster of dynamic support from the 20- and 50-day EMAs between roughly $1,863 and $1,842, ahead of the more distant floor at $1,806. A deeper pullback would expose the next static supports at $1,741 and $1,524.
On the topside, immediate resistance is located at the 100-day EMA at $1,933, with further barriers at $2,018 and $2,108. A sustained break above these would open the way toward $2,211 and the more ambitious objectives at $2,388 and $2,746.
(The technical analysis of this story was written with the help of an AI tool. Know more.)

Lebih dari satu juta pengguna mengandalkan FXStreet untuk data pasar real-time, alat charting, wawasan ahli, dan berita forex. Kalender ekonomi komprehensif dan webinar edukatif membantu trader tetap mendapat informasi dan membuat keputusan terukur. FXStreet memiliki sekitar 60 profesional yang tersebar antara kantor pusat Barcelona dan berbagai wilayah global.
Baca Selengkapnya