

Trading
Jelajahi berbagai pasar dengan harga kompetitif, likuiditas mendalam, dan alat trading canggih.
Pelajari Lebih Lanjut 
Platform
Trading dengan lancar menggunakan platform canggih TMGM, dibangun untuk kecepatan, presisi, dan pengalaman trading yang superior.
Pelajari Lebih Lanjut Platform Trading
Akademi
Pelajari dasar-dasar trading dengan sumber daya yang ramah pemula, termasuk panduan, webinar, dan wawasan pasar.
Pelajari Lebih Lanjut Berita & Analisis
Dapatkan update pasar real-time dan analisis ahli untuk tetap unggul dalam peluang trading
Pelajari Lebih Lanjut Berita & Analisis
Tentang
Pelajari apa yang membedakan TMGM — kehadiran global kami, kekuatan regulasi, dan komitmen terhadap inovasi dalam trading.
Pelajari Lebih Lanjut Mengapa Memilih TMGM
Sponsorship
Ripple and Stellar outlook: Momentum improves as bulls target further gains
- XRP hovers around $1.518 on Tuesday after gaining nearly 9% the previous day.
- XLM claims $0.213 after surging over 9% on Monday.
- Strengthening momentum indicators support further gains while mixed derivatives metrics could cap upside potential.
Ripple (XRP) and Stellar (XLM) stabilize on Tuesday after extending their gains by nearly 9% at the start of the week on Monday. Improving momentum indicators support XRP and XLM bullish price action and hint at further rally. Meanwhile, traders should remain cautious as mixed derivatives data could limit upside as both tokens try to sustain their recent upswing.

Mixed derivatives metrics
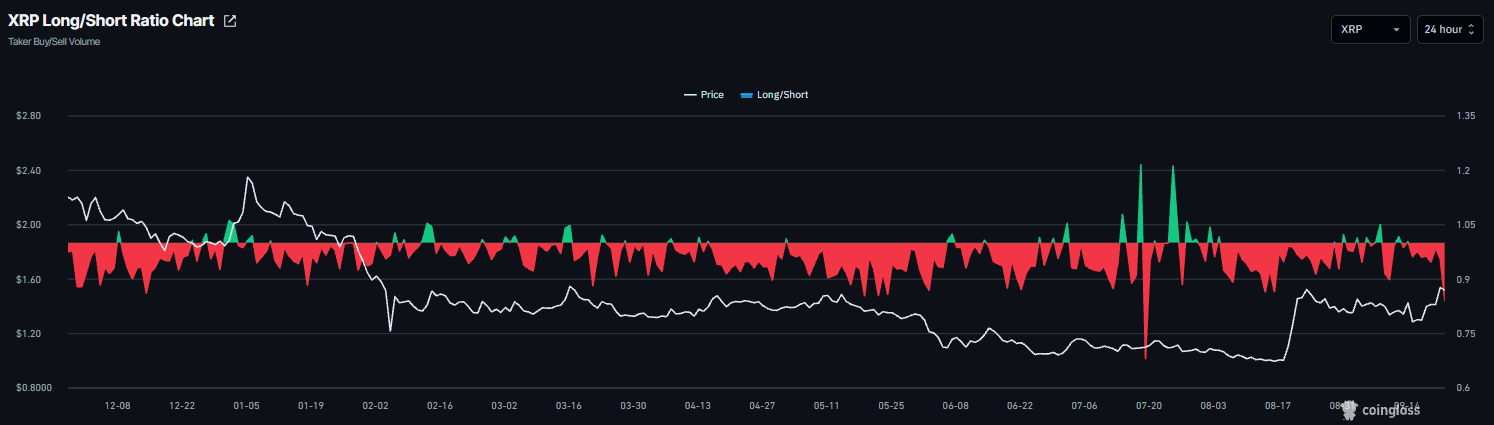
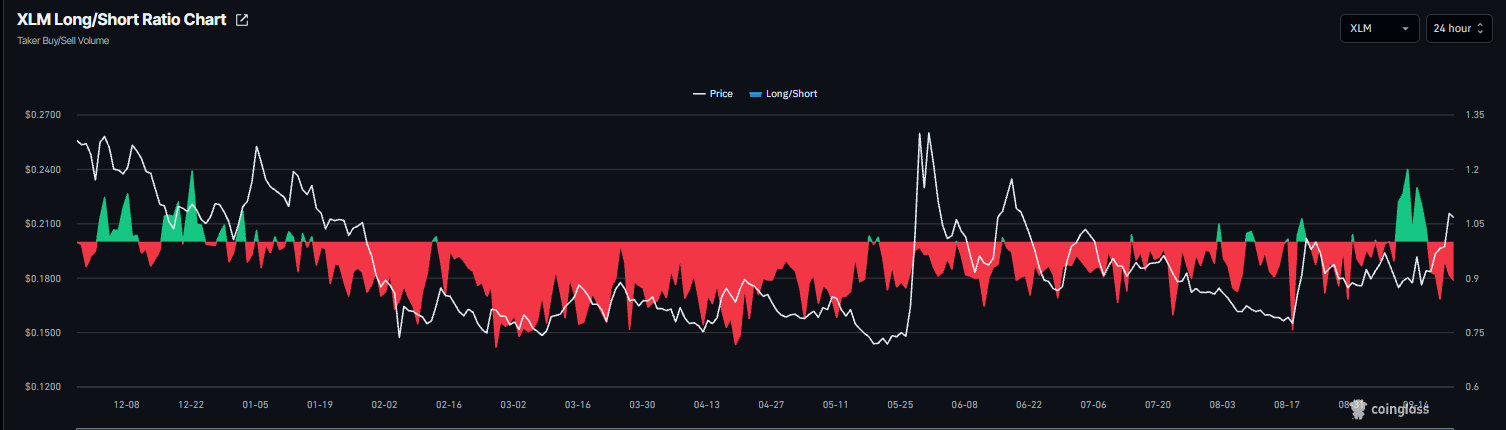
Derivatives data shows a mixed and cautious outlook among traders, despite recent gains in XRP and XLM. CoinGlass’ long-to-short ratios for Ripple and Stellar read 0.86 and 0.89, respectively, on Tuesday, nearing their lowest levels in a month. A ratio below one indicates bearish sentiment, as traders bet that asset prices will fall.
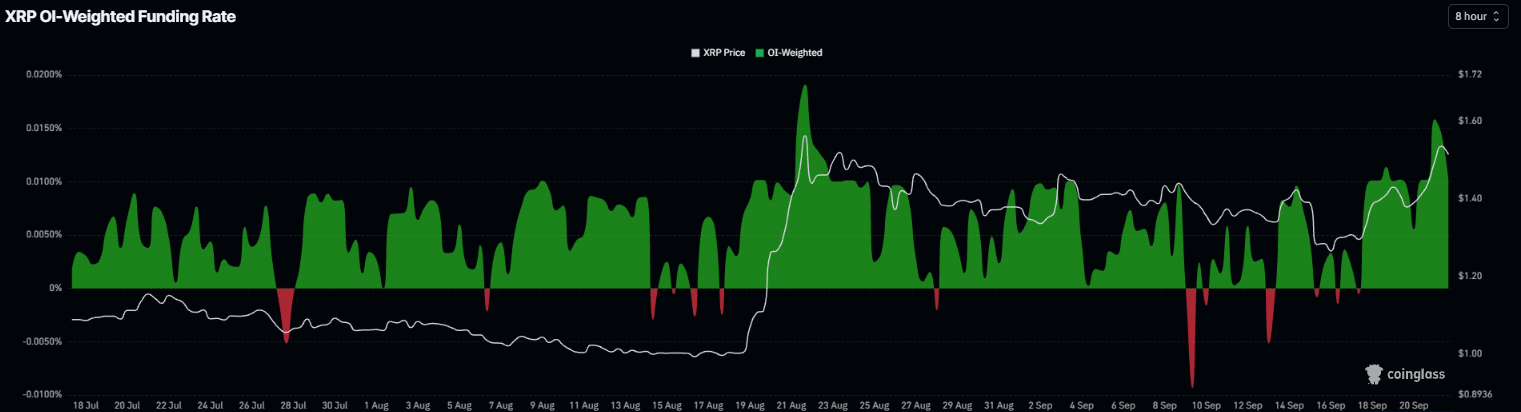
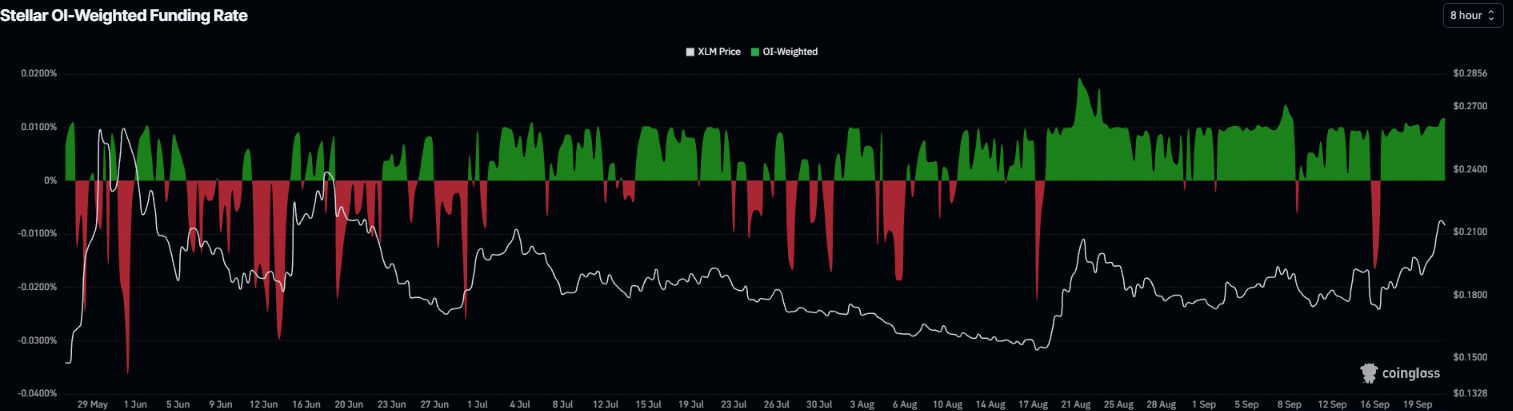
However, the funding rates for both altcoins support a bullish outlook. The XRP funding rate flipped positive on September 18 and surged to 0.010% on Tuesday. Similarly, the XLM funding rate flipped positive on September 16 and surged to 0.011% on Tuesday. These positive rates indicate longs are paying shorts, reflecting a bullish outlook for Ripple and Stellar.
XRP technical outlook: Surges after holding key level
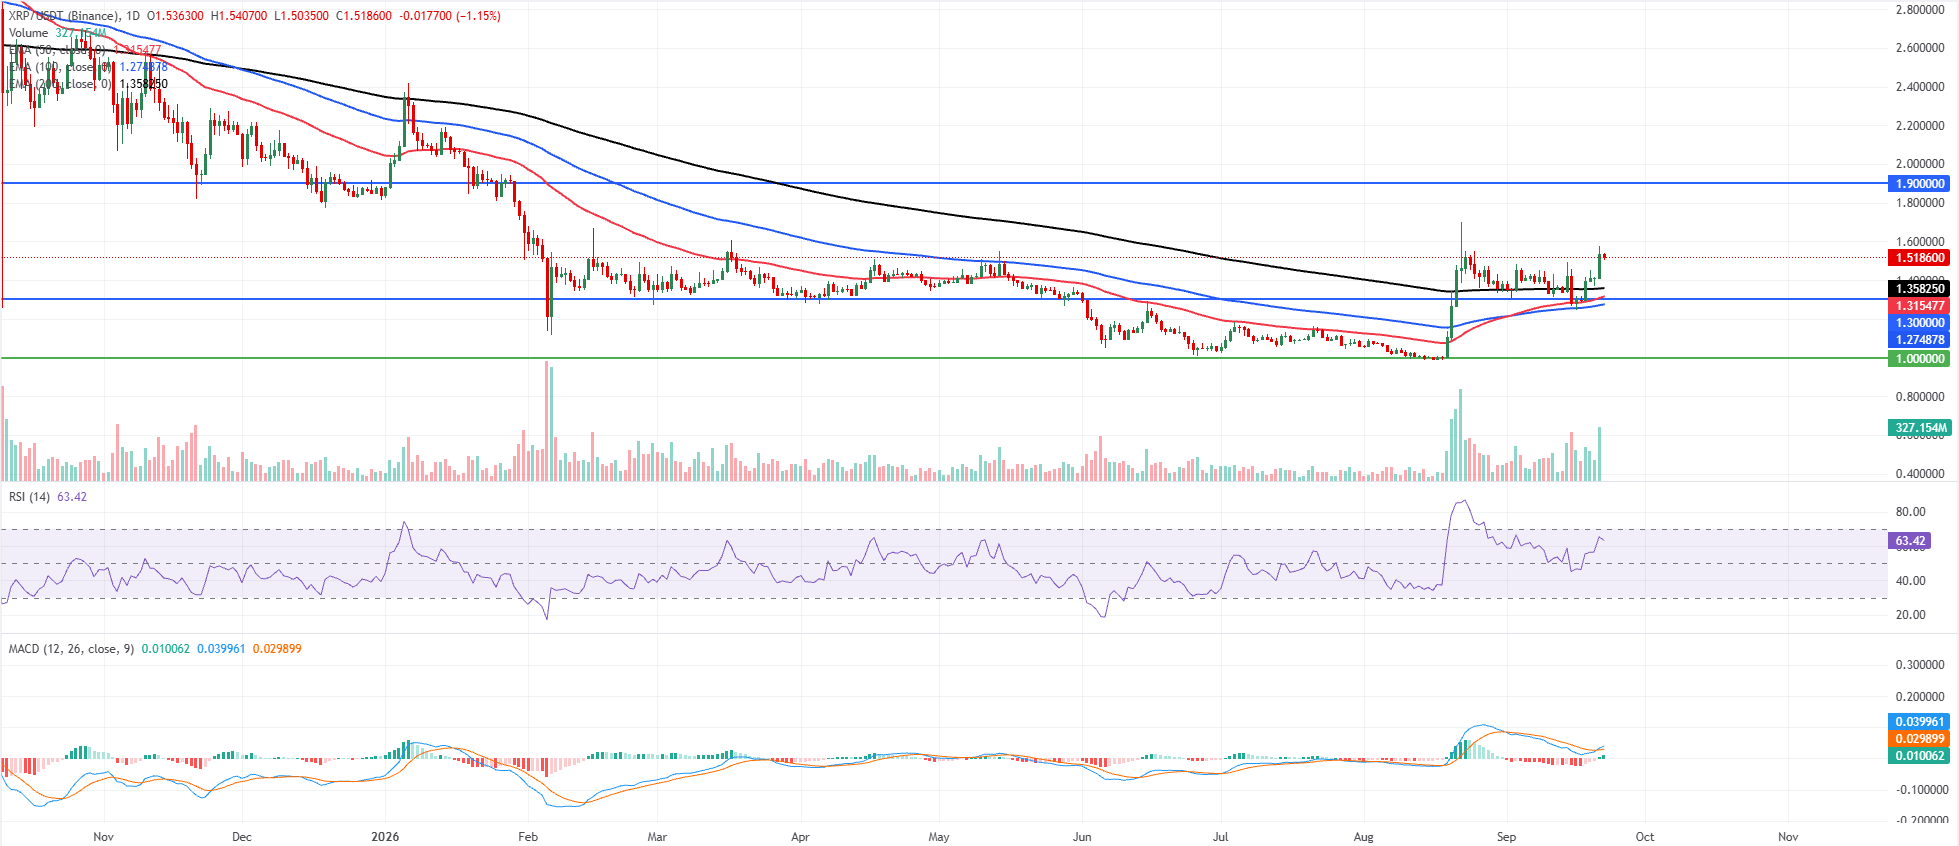
XRP price trades at $1.518 on Tuesday, extending its bullish bias as price holds well above the 50-day, 100-day, and 200-day Exponential Moving Averages (EMAs), clustered between roughly $1.274 and $1.358.
The rebound from recent lows has pushed the Relative Strength Index (RSI) to 63, indicating firm but not yet overbought momentum. At the same time, the Moving Average Convergence Divergence (MACD) has turned positive, hinting that buyers are regaining control after a period of consolidation.
On the downside, immediate support is at the 200-day EMA at $1.358, and the 50-day EMA at $1.315, with horizontal support at $1.300 reinforcing this zone; a deeper pullback could test the 100-day EMA at $1.274 before the major structural floor at $1.000.
On the topside, the next notable resistance aligns with the horizontal barrier at $1.900, where a sustained break would open the way for further gains in the broader uptrend.
XLM technical outlook: Strengthening momentum indicators
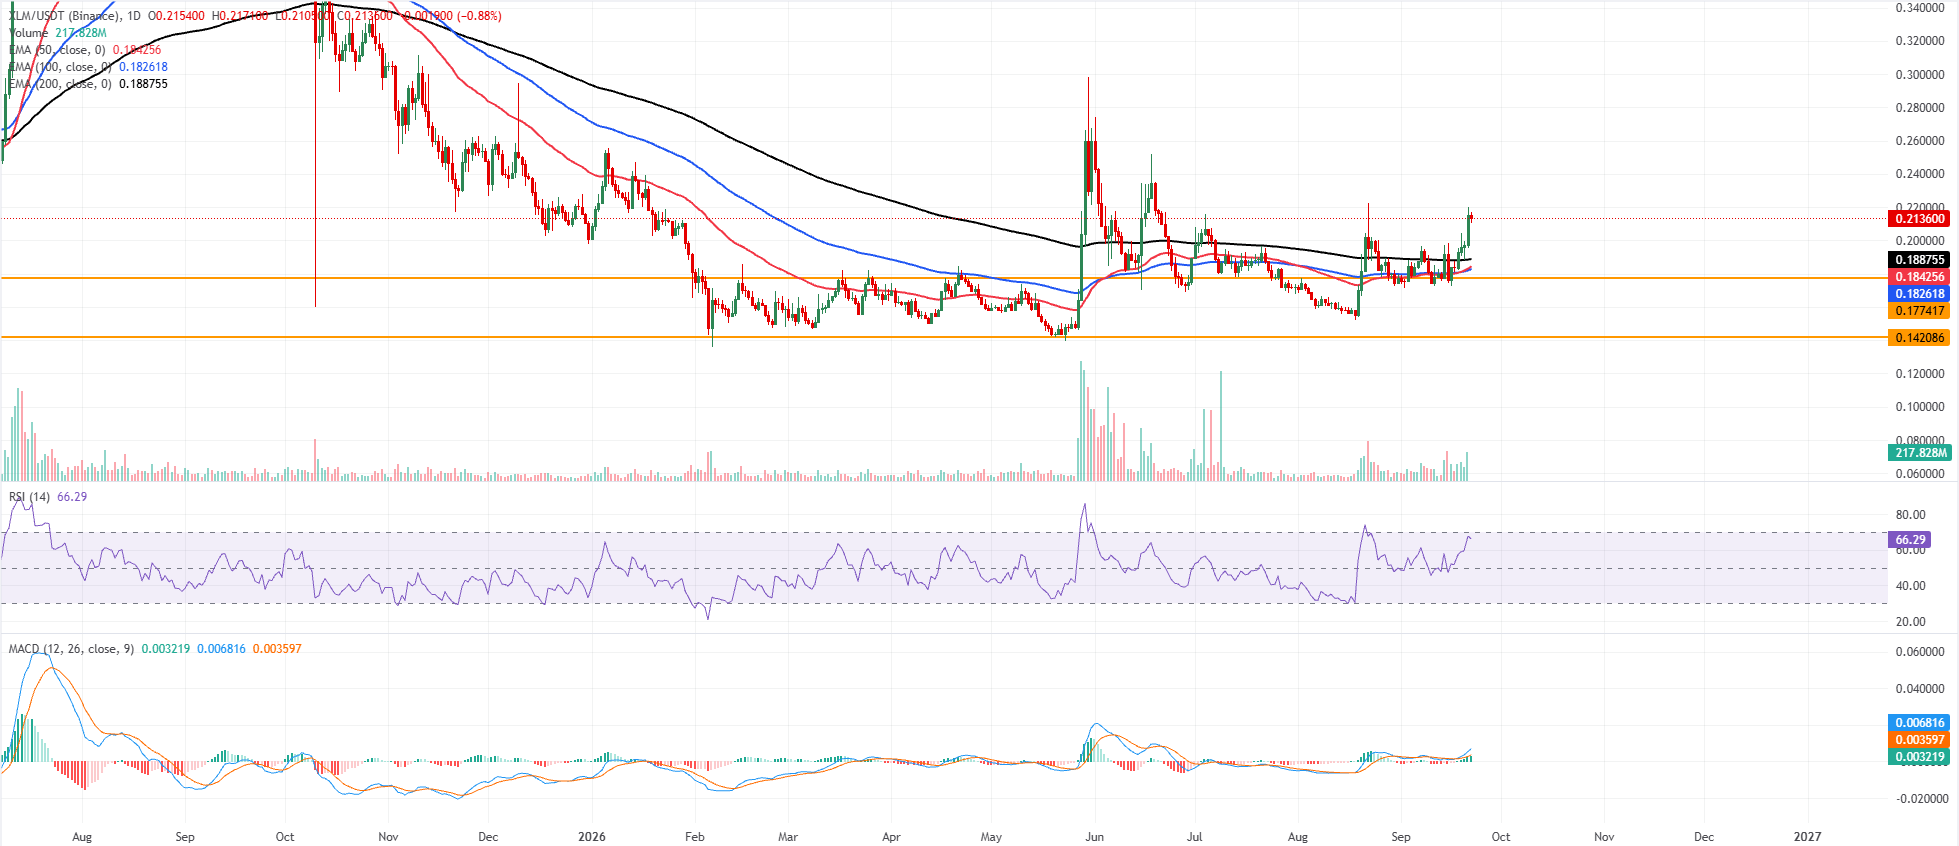
XLM price trades at $0.2135 on Tuesday after gaining over 9% the previous day. XLM maintains a clear bullish bias as price holds above the 50-day, 100-day, and 200-day EMAs, clustered between roughly $0.182 and $0.188.
The rising RSI near 66 and a positive MACD histogram both suggest strong upward momentum, reinforcing the view that the recent breakout is supported by underlying demand rather than a mere spike.
On the downside, initial support appears at the 200-day EMA near $0.188, followed by the short-term 50-day EMA around $0.184 and the 100-day EMA at $0.182, which together create a dense demand zone before the horizontal base at $0.177. A deeper pullback would expose the more distant structural floor near $0.142, but as long as XLM holds above the EMA cluster, buyers are likely to defend dips, keeping the path of least resistance pointed higher.
(The technical analysis of this story was written with the help of an AI tool. Know more.)
Top Articles
1Pepe Price Forecast: PEPE signals trend reversal amid a short squeeze2India Gold price today: Gold falls, according to FXStreet data3AUD/JPY Price Forecast: Sticks to gains above 112.00 as bulls await 50% Fibo. breakout4Swiss Franc gains as US Dollar declines on increased risk appetite5Gold struggles to lure buyers amid hawkish Fed counters sliding US bond yields6Crypto Overview: Bitcoin tops $85,000 post-CLARITY Act failure – TAO and FET lead gains7Ripple and Stellar outlook: Momentum improves as bulls target further gains8RBA’s Bullock: Supply shocks are difficult for monetary policy to deal with9US Dollar Index Price Forecast: Needs a decisive move above 100.56 for fresh upside leg
KUOTASI LANGSUNG

SEMUA TENTANG TECHNICAL
Double Exponential Moving Average: Cara Kerjanya & Cara Menggunakannya
Apa Itu Golden Cross? Panduan Pembentukan dan Trading
Pola Chart Pennant Flag Bullish dan Bearish: Bagaimana Cara Tradingnya?
Apa Itu Pola Candlestick Pin Bar?
Apa Itu Price Action dalam Trading?
Pola Grafik Segitiga Naik dan Turun: Apa Itu dan Bagaimana Cara Memperdagangkannya?
Bagaimana Cara Memperdagangkan Pola Morning Star dan Evening Star?
Pola Candlestick Engulfing Bullish dan Bearish
Memahami Pola Grafik Double Top dan Double Bottom
Mulai Sekarang!
Daftar dan akses Pasar Global dalam waktu kurang dari 3 menit

Terhubung dengan Kami












Informasi yang disediakan di situs web ini hanya bersifat umum dan bukan merupakan nasihat keuangan pribadi. Sebelum bertindak berdasarkan informasi apa pun di situs web ini, Anda harus mempertimbangkan kesesuaian informasi tersebut dengan tujuan, situasi keuangan, dan kebutuhan Anda. Berinvestasi dalam CFD dan Kontrak Margin FX mengandung risiko yang signifikan dan tidak cocok untuk semua investor. Anda dapat kehilangan lebih dari setoran awal Anda. Anda tidak memiliki, atau mempunyai, kepentingan apa pun atas aset acuan. Kami menyarankan agar Anda mencari nasihat independen dan memastikan bahwa Anda sepenuhnya memahami risiko yang terlibat sebelum melakukan trading. Penting bagi Anda untuk membaca dan mempertimbangkan dokumen pengungkapan sebelum Anda memperoleh produk apa pun yang tercantum di situs web ini. Informasi dan iklan yang ditawarkan di situs web ini tidak ditujukan untuk digunakan oleh siapa pun di negara atau yurisdiksi mana pun jika penggunaan tersebut bertentangan dengan hukum dan peraturan setempat. Produk dan Layanan yang ditawarkan di situs web ini tidak ditujukan bagi penduduk Amerika Serikat, Malaysia, dan Thailand.
TMGM diotorisasi dan diatur di berbagai yurisdiksi.
Trademax Australia Limited, yang beroperasi sebagai TMGM, diatur oleh Australian Securities and Investments Commission (ASIC), AFSL no. 436416 dan berlokasi di Level 28, One International Tower, 100 Barangaroo Avenue, 2000 Sydney, NSW Australia.
Email: [email protected]
Trademax Global Limited, yang beroperasi sebagai TMGM, diotorisasi dan diatur oleh Vanuatu Financial Services Commission (VFSC), nomor registrasi 40356 dan terdaftar di 1276, Kumul Highway, Port Vila, Vanuatu, Republic of Vanuatu.
Email: [email protected]
Trademax Global Markets (SE) Limited, berdagang sebagai TMGM, diberi wewenang dan diatur oleh Financial Services Authority (FSA) Seychelles dengan nomor lisensi SD224. Perusahaan terdaftar di Kantor No. 13, Providence Estate ABIS Centre, Mahe, Seychelles.
Email: [email protected]
Trademax Global Markets (International) Pty Ltd, yang beroperasi sebagai TMGM, diotorisasi dan diatur oleh Financial Services Commission, Mauritius (FSC) dengan lisensi no. GB22201012, dan terdaftar di 33, Edith Cavell Street C/o IQ EQ Fund Services (Mauritius) Ltd Port Louis, 11324 Mauritius.
Email: [email protected]
Hak Cipta © TMGM. Semua hak dilindungi