

Ripple Price Forecast: XRP eyes $1.50 breakout despite softening on-chain activity
- XRP remains elevated near $1.45 after a sharp spike from the weekly low of $1.31.
- XRP Ledger activity has normalized after a sharp August spike pushed daily active addresses near 930,000.
- XRP retains a neutral-to-bullish technical outlook, supported by the RSI and uptrending moving averages.
Ripple (XRP) holds onto a bullish bias, trading near $1.45 at the time of writing on Friday. The remittance token is taking a breather after breaking out from $1.31 to highs at $1.48 the day before, underscoring the return of bulls into the back against the backdrop of a drop from August’s peak of $1.70.

The path of least resistance remains primarily upward, backed by a strengthening technical structure as major moving averages trail the spot price as it rises.
XRP on-chain activity moderates
On-chain activity on the XRP Ledger (XRPL) has moderated since the surge to 930,000 active addresses in August. According to Santiment’s data, the number of wallets interacting with the protocol by sending or receiving value has normalized to about 26,000.
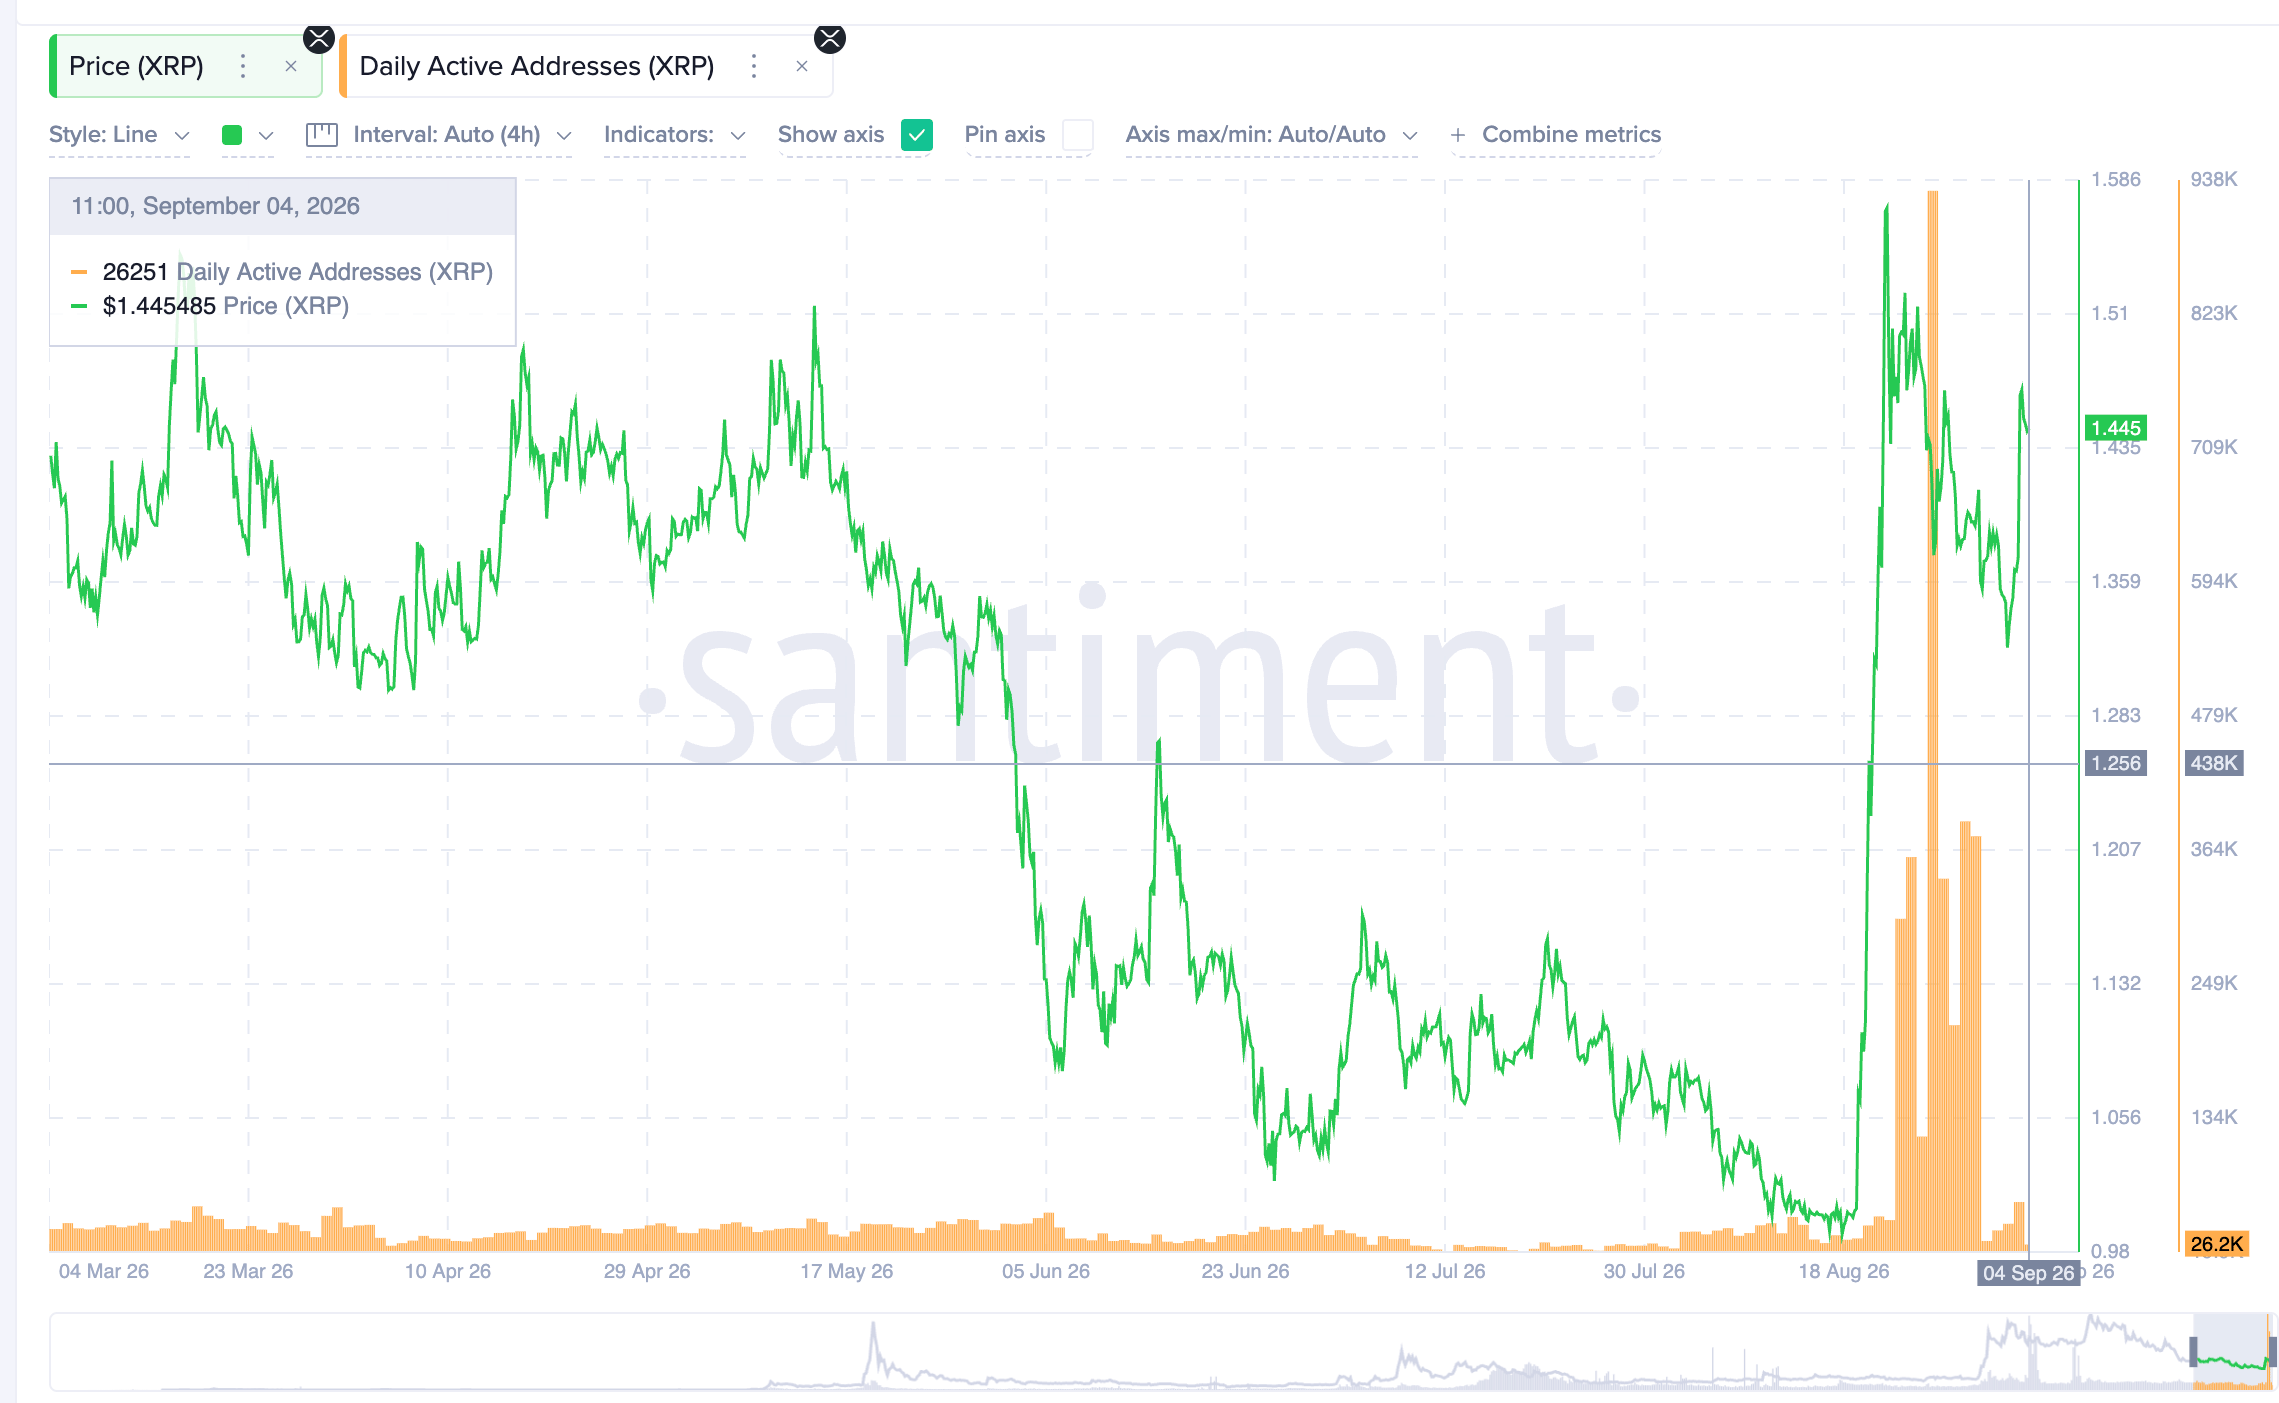
The August surge was an outlier, fueled by increased user participation as prices broadly rose across the crypto market. XRP rallied to $1.70, aligning with positive market sentiment. Since the spot price remains relatively elevated, a rise in on-chain activity could boost the token’s short- to medium-term outlook.
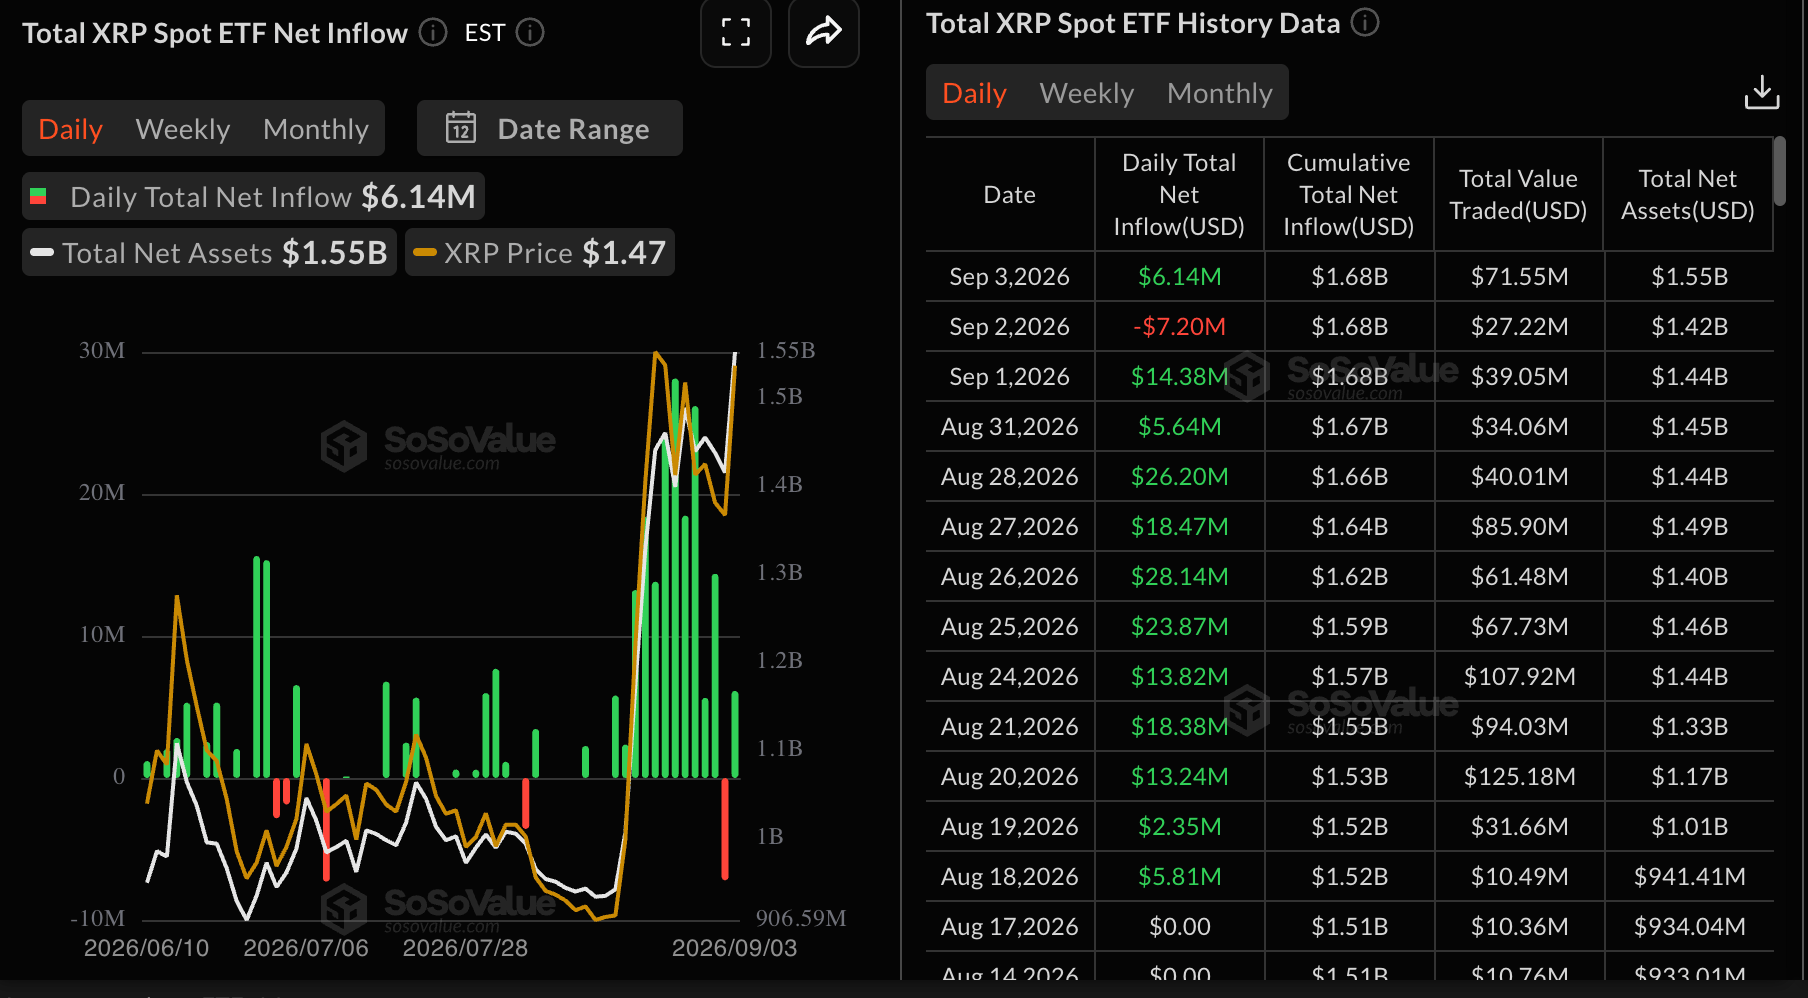
Meanwhile, XRP spot Exchange-Traded Funds (ETFs) notched nearly $19 million in inflows through Thursday, suggesting reduced but steady risk-on sentiment. Last week, cumulative inflows averaged $110 million, the highest level since early December.
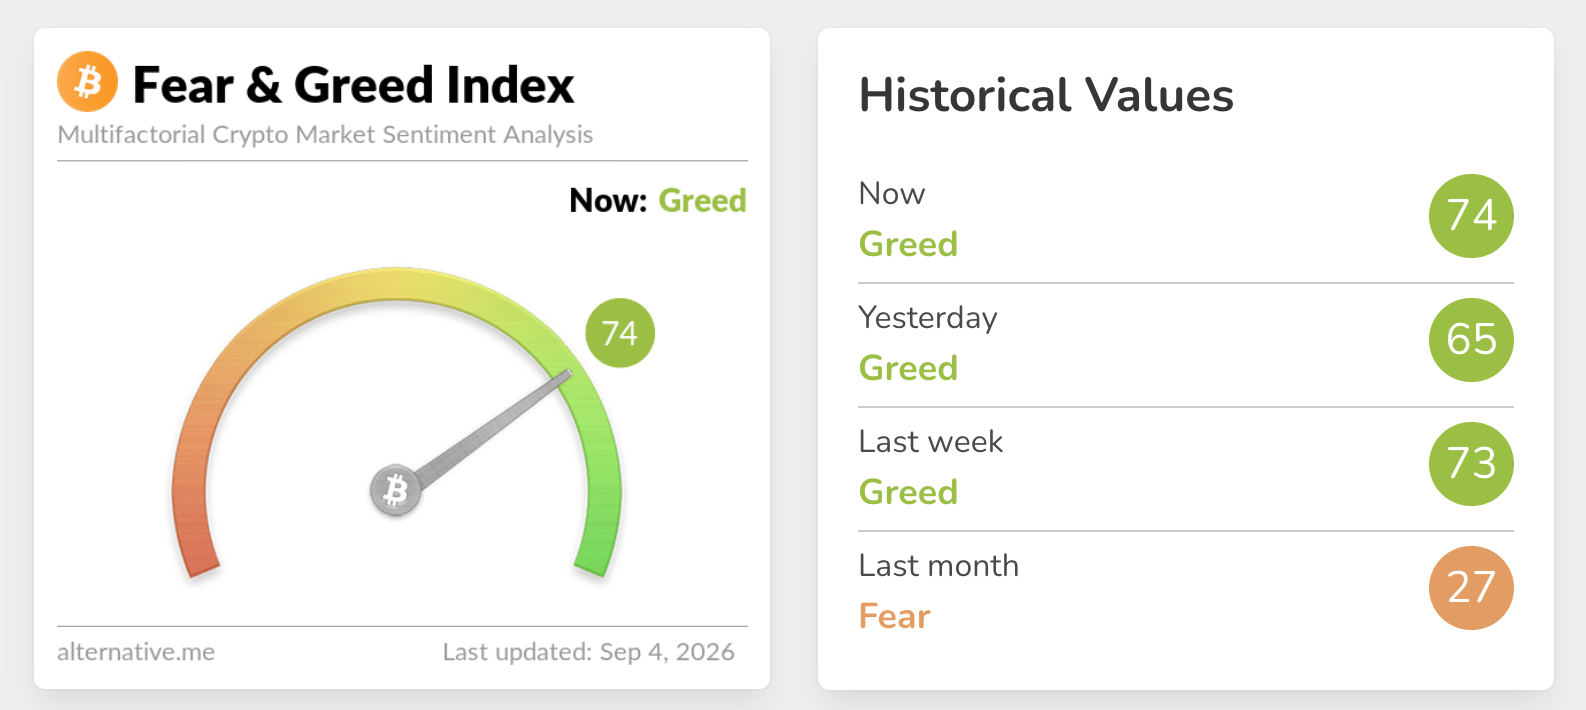
The Crypto Fear & Greed Index remains in the Greed territory at 74 on Friday, increasing from 65 the previous day. This uptick aligns with growing appetite for risk assets, as highlighted by US-listed spot ETFs.
Technical analysis: XRP bulls tighten grip
XRP trades at $1.44, while holding a clear bullish bias as price sits well above the 50-day, 100-day, and 200-day Exponential Moving Averages (EMAs), with the long-term EMA at $1.36 underpinning the advance.
Momentum remains constructive, with the Relative Strength Index (RSI) near 66, suggesting strong but not yet overbought conditions, while the slightly negative Moving Average Convergence Divergence (MACD) reading hints at a mild pause rather than a full-fledged reversal within the broader uptrend.
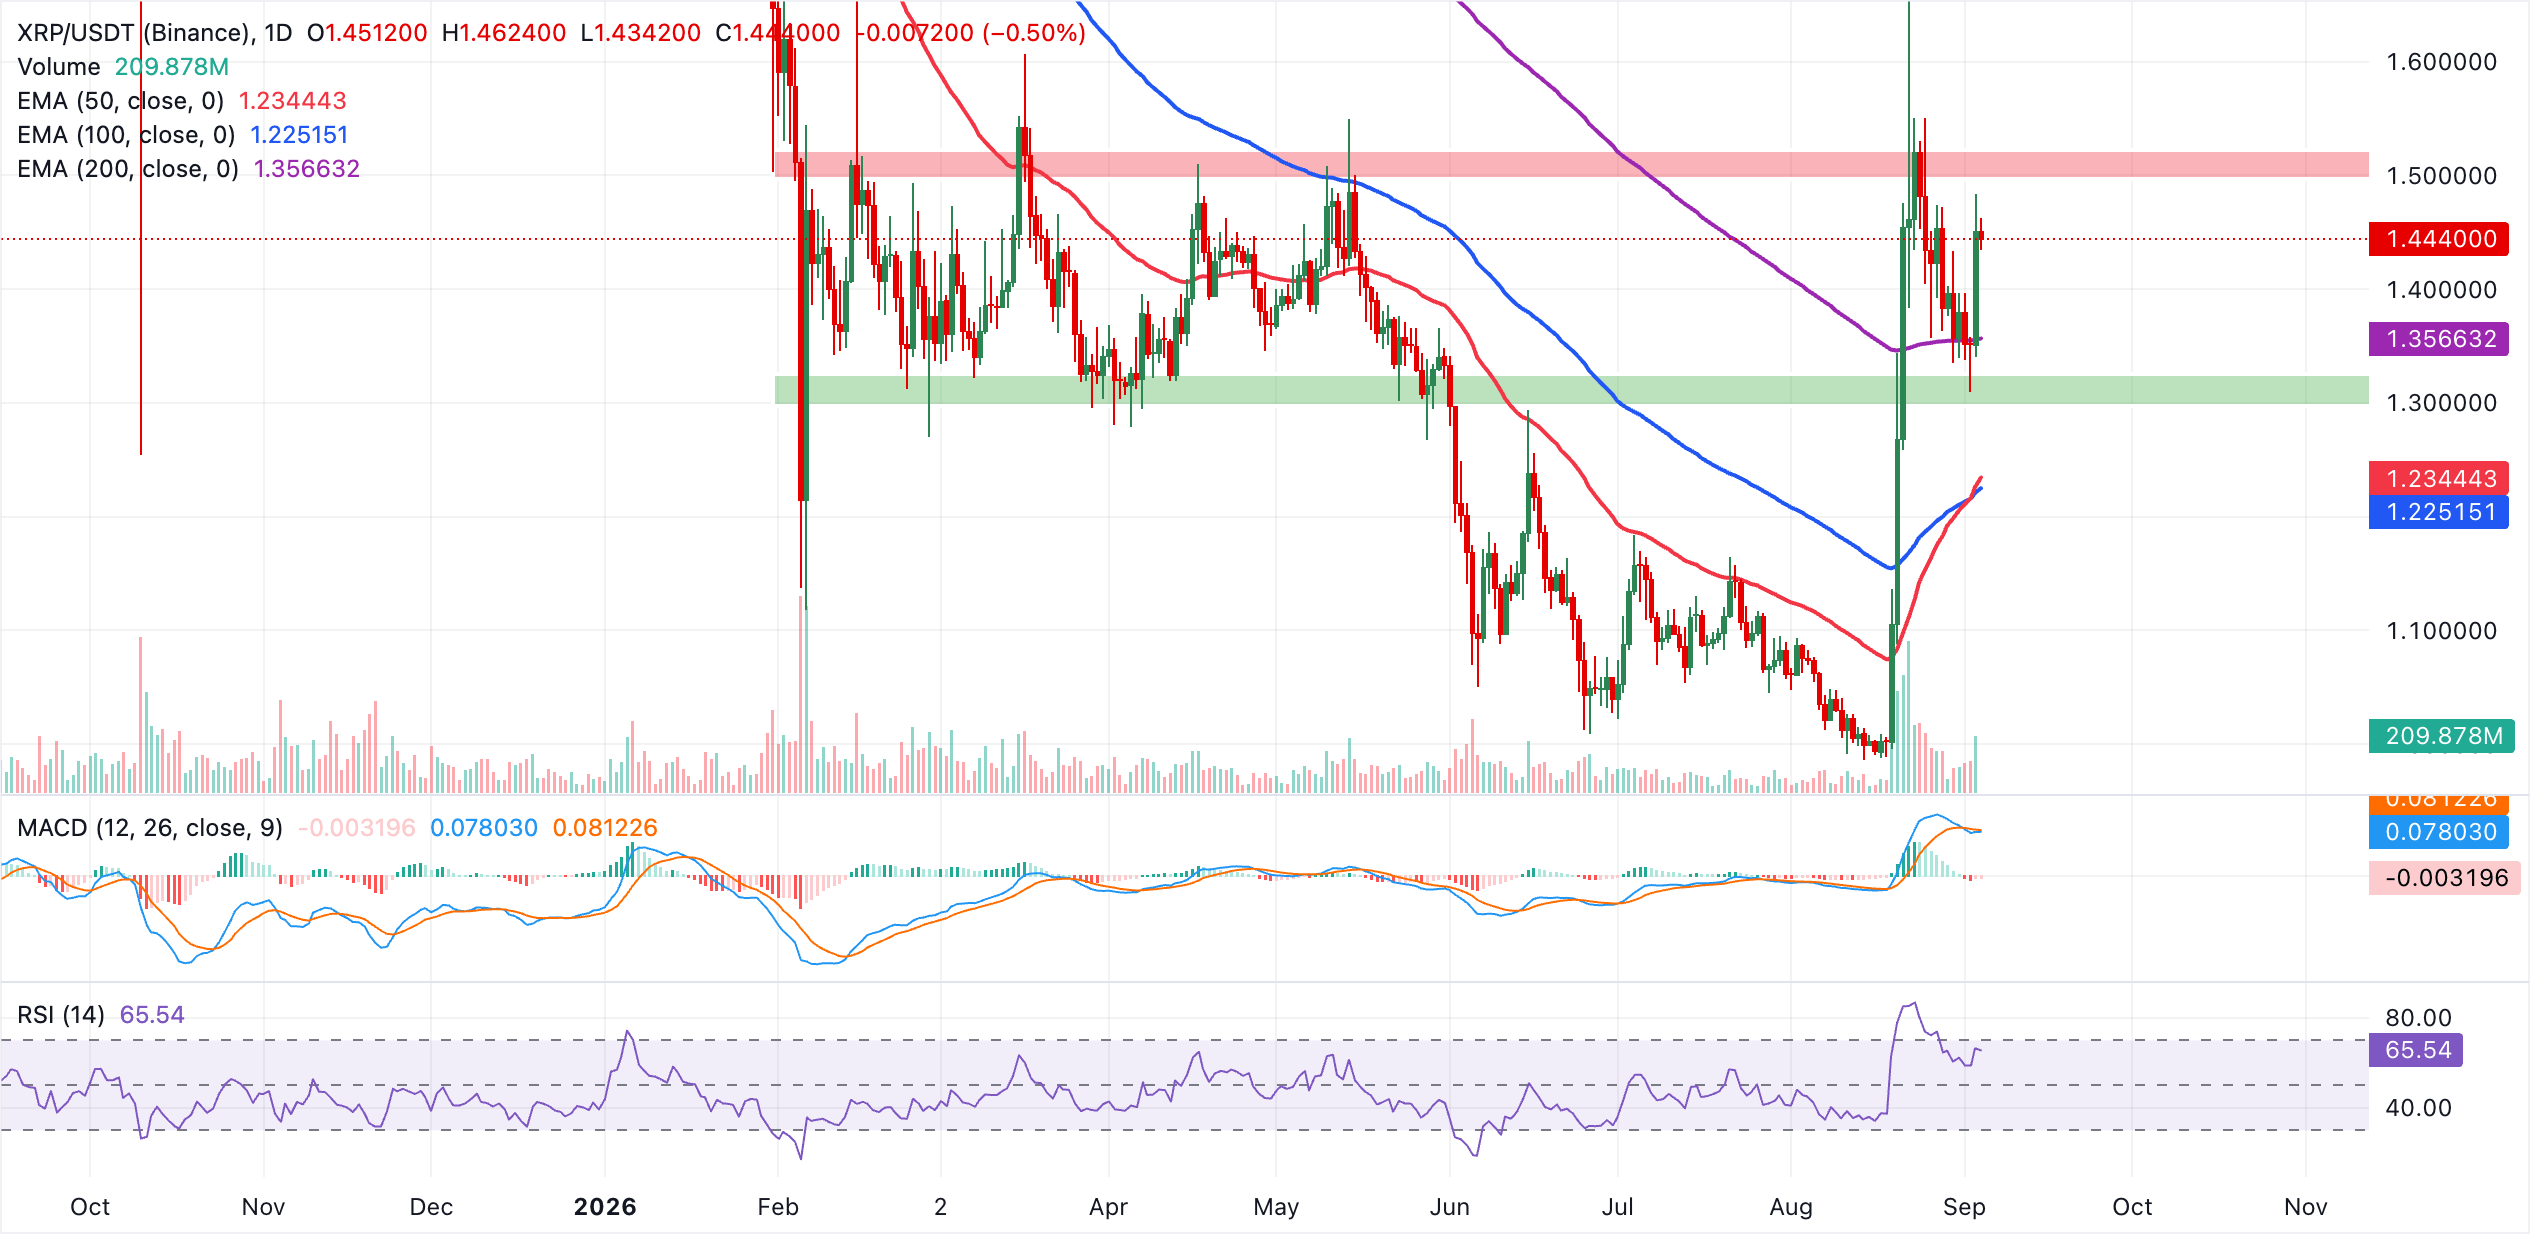
On the downside, immediate support is seen at the psychological $1.40 level, followed by the 200-day EMA around $1.36, where a deeper pullback could test the durability of the latest breakout. Below that, the 50-day and 100-day EMAs clustered around $1.23 offer a secondary demand zone that would likely attract dip-buying interest if reached, keeping the medium-term structure constructive as long as price holds above these dynamic floors.
(The technical analysis of this story was written with the help of an AI tool. Know more.)
Cryptocurrency metrics FAQs
The developer or creator of each cryptocurrency decides on the total number of tokens that can be minted or issued. Only a certain number of these assets can be minted by mining, staking or other mechanisms. This is defined by the algorithm of the underlying blockchain technology. On the other hand, circulating supply can also be decreased via actions such as burning tokens, or mistakenly sending assets to addresses of other incompatible blockchains.
Market capitalization is the result of multiplying the circulating supply of a certain asset by the asset’s current market value.
Trading volume refers to the total number of tokens for a specific asset that has been transacted or exchanged between buyers and sellers within set trading hours, for example, 24 hours. It is used to gauge market sentiment, this metric combines all volumes on centralized exchanges and decentralized exchanges. Increasing trading volume often denotes the demand for a certain asset as more people are buying and selling the cryptocurrency.
Funding rates are a concept designed to encourage traders to take positions and ensure perpetual contract prices match spot markets. It defines a mechanism by exchanges to ensure that future prices and index prices periodic payments regularly converge. When the funding rate is positive, the price of the perpetual contract is higher than the mark price. This means traders who are bullish and have opened long positions pay traders who are in short positions. On the other hand, a negative funding rate means perpetual prices are below the mark price, and hence traders with short positions pay traders who have opened long positions.














