

The Dow Jones Industrial Average buys a peace nobody has signed, and the chips take it back
- DJIA trades near 52,200 after an intraday run to just short of 52,600 met a semiconductor rout with nothing to do with Iran.
- Crude Oil drops around 7% on a weekend stand-down Washington partly attributes to running short of targets, with Tehran offering conditional silence rather than a signature.
- Wednesday's Federal Reserve decision still carries a hike tail above 35%, unchanged from last week despite the collapse in the war premium.
The Dow Jones Industrial Average trades near 52,200, up around 250 points, after a session that handed it the month's cleanest bullish catalyst and then took most of it back. The peace bid carried the index to just short of 52,600 before a semiconductor sell-off with Chinese fingerprints dragged it back to the 52,000 handle, with the late tape reclaiming half of that fade.

A pause is not peace
The United States and Iran stood down over the weekend after roughly two weeks of nightly strikes, and Crude Oil repriced hard, Brent falling around 7% to the $90.00 handle and West Texas Intermediate to near $84.00 after a look above $100.00 last week. Trump says the talks are making progress. Tehran has confirmed nothing beyond a reported willingness to hold fire for as long as Washington does.
The reason behind the pause matters more than the fact of it, and wire reporting attributes the halt in part to advisers warning the campaign was running short of worthwhile targets and drawing down munitions faster than the Pentagon finds comfortable. That is an inventory problem wearing a diplomatic suit. The physical evidence has not caught up either, with transit through Hormuz and the Bab al-Mandeb slowing again over the weekend while Yemen's Houthis kept claiming attacks on Saudi shipping.
This is the fourth de-escalation the tape has bought since April, after the truce, the May ceasefire and last month's peace framework, each of which broke within weeks. Four days ago the president was weighing an attack he described as bigger than anything that came before. Paying for peace and getting it are different transactions, and Crude Oil keeps relearning the difference.
The sell-off that had nothing to do with Iran
The peace bid ran instead into a supply chain story out of China, where reporting that domestic toolmakers have started mass producing homegrown deep ultraviolet lithography machines took more than 7% out of the dominant Western supplier and knocked around 3% off the benchmark semiconductor complex. Advanced Micro Devices (AMD) dropped 7%, Teradyne (TER) 5.9% and Micron (MU) 4%, erasing an early rally built on a Chinese memory maker's blockbuster Shanghai debut.
The divergence explains the day's scoreboard, with the S&P 500 and the Nasdaq Composite both lower while the Dow holds a gain of roughly half a percent. The insulation is mechanical rather than clever, because a price-weighted average gives Nvidia (NVDA) only a modest slice, so a chip rout costs this index far less than it costs a capitalisation-weighted benchmark.
What the Dow does own is the fuel bill, since the names that dominate the average burn energy rather than sell it. SpaceX (SPCX), trading near half its post-listing high and beneath its offer price for an eighth session, is the temperature reading from the other end of the risk spectrum. The average that spent July as a war shelter is now the cleanest way to own the peace.
The rates market declines the peace dividend
June durable goods orders, out at 12:30 GMT, rose 0.3% against a 1.6% consensus and a 4% contraction the month before, with orders excluding transportation up 0.6% and the nondefense capital goods ex aircraft line, the release's proxy for business investment, up 0.9%. The headline is a growth miss, not an inflation signal, and the front end ignored it entirely.
Wednesday's decision still carries a hike tail of 35.8%, unchanged from where futures pricing sat before Crude Oil surrendered 7% and last week's war premium came out of the barrel. Further out the curve trimmed only at the margin: at least one hike reads 80.3% by 16 September, 85.9% by 28 October and 91.0% by 9 December, with a 57.0% chance of two by then.
June's minutes rested the disinflation base case explicitly on Hormuz disruptions diminishing, and those disruptions have now diminished, at least for three days. The market's answer has been to leave Wednesday's hike odds untouched and shave a point or two off the autumn. Either traders do not believe the pause, or they have decided the inflation problem was never mostly about the barrel.
The calendar does the talking this week
The Federal Reserve decision lands Wednesday at 18:00 GMT, consensus a hold at 3.75%, no projections attached, press conference at 18:30. Thursday stacks the June Personal Consumption Expenditures price index at 12:30 GMT, core seen at 0.2% MoM and 3.3% YoY, against the first reading of second quarter Gross Domestic Product at 2.1% annualised and jobless claims at 204K after 187K.
Friday adds the second quarter Employment Cost Index at 0.8%, the Chicago Purchasing Managers Index at 56 and the Michigan survey, with one-year inflation expectations at 4.2% and the five-year at 3.3%. Microsoft (MSFT), Apple (AAPL) and Amazon (AMZN) all report from inside the index this week, Meta Platforms (META) reports from outside it, and Alphabet (GOOGL), which joined the average in late June, has already set a bar low enough to trip over.
Chart levels
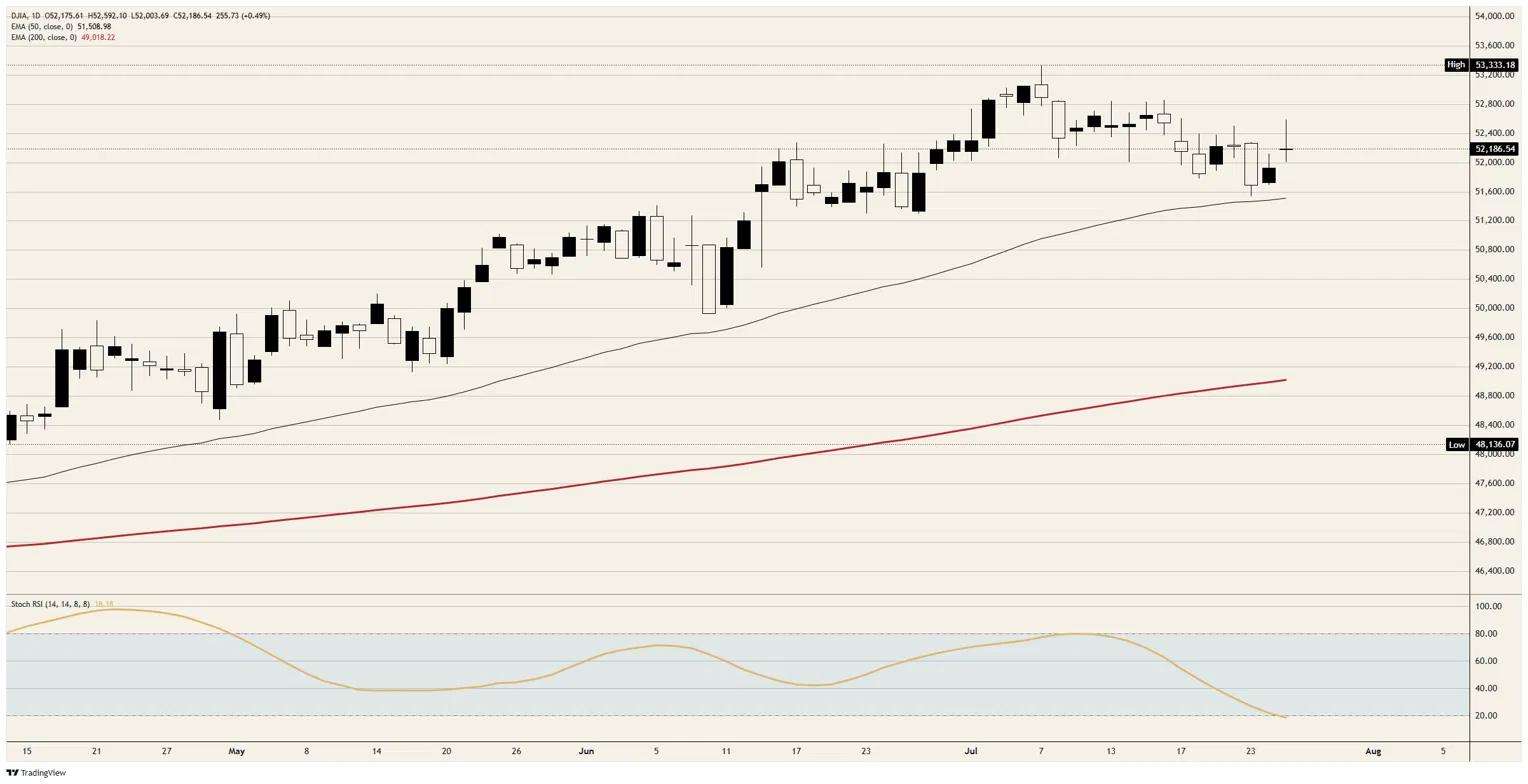
Resistance: The session high just short of 52,600 is the ceiling the peace trade could not clear, and a daily close above it reopens the 52,800 area ahead of the record near 53,300.
Support: The 52,000 handle absorbed the afternoon fade and carries the tape now, with 51,800 beneath it and the rising 50-day Exponential Moving Average near 51,500 as the last defence, the level that held the war flush last week.
Bias: Bullish above 52,000. Two consecutive gains off the 51,500 area, a daily Stochastic Relative Strength Index near 18 and turning up, and a reclaimed 52,000 handle together describe a base rather than a top, and last week's bearish case expires on that reclaim. A daily close back beneath 51,800 revives it.
Dow Jones daily chart
Dow Jones FAQs
The Dow Jones Industrial Average, one of the oldest stock market indices in the world, is compiled of the 30 most traded stocks in the US. The index is price-weighted rather than weighted by capitalization. It is calculated by summing the prices of the constituent stocks and dividing them by a factor, currently 0.152. The index was founded by Charles Dow, who also founded the Wall Street Journal. In later years it has been criticized for not being broadly representative enough because it only tracks 30 conglomerates, unlike broader indices such as the S&P 500.
Many different factors drive the Dow Jones Industrial Average (DJIA). The aggregate performance of the component companies revealed in quarterly company earnings reports is the main one. US and global macroeconomic data also contributes as it impacts on investor sentiment. The level of interest rates, set by the Federal Reserve (Fed), also influences the DJIA as it affects the cost of credit, on which many corporations are heavily reliant. Therefore, inflation can be a major driver as well as other metrics which impact the Fed decisions.
Dow Theory is a method for identifying the primary trend of the stock market developed by Charles Dow. A key step is to compare the direction of the Dow Jones Industrial Average (DJIA) and the Dow Jones Transportation Average (DJTA) and only follow trends where both are moving in the same direction. Volume is a confirmatory criteria. The theory uses elements of peak and trough analysis. Dow’s theory posits three trend phases: accumulation, when smart money starts buying or selling; public participation, when the wider public joins in; and distribution, when the smart money exits.
There are a number of ways to trade the DJIA. One is to use ETFs which allow investors to trade the DJIA as a single security, rather than having to buy shares in all 30 constituent companies. A leading example is the SPDR Dow Jones Industrial Average ETF (DIA). DJIA futures contracts enable traders to speculate on the future value of the index and Options provide the right, but not the obligation, to buy or sell the index at a predetermined price in the future. Mutual funds enable investors to buy a share of a diversified portfolio of DJIA stocks thus providing exposure to the overall index.














