

Pi Network Price Forecast: PI recovery stalls amid risks of a fresh record low
- Pi Network edges lower on Friday, after three consecutive days of mild recovery.
- The announcement of the Mainnet upgrade to Stellar Protocol version 26 failed to lift retail speculation and interest.
- The technical outlook for PI is mixed, with bearish momentum easing.
Pi Network (PI) hovers above $0.0800 on Friday, after three consecutive days of recovery. Still, the social interest and speculative demand remain low in PI, with a declining trend in the PI Open Interest. The technical outlook for PI is mixed, with downside momentum easing while demand remains low.

Pi Network’s hype cools
Pi Network announced the Stellar Protocol version 26 upgrade to its mainnet, with a deadline set for August 11. However, the announcement failed to lift retail support for the PI token.
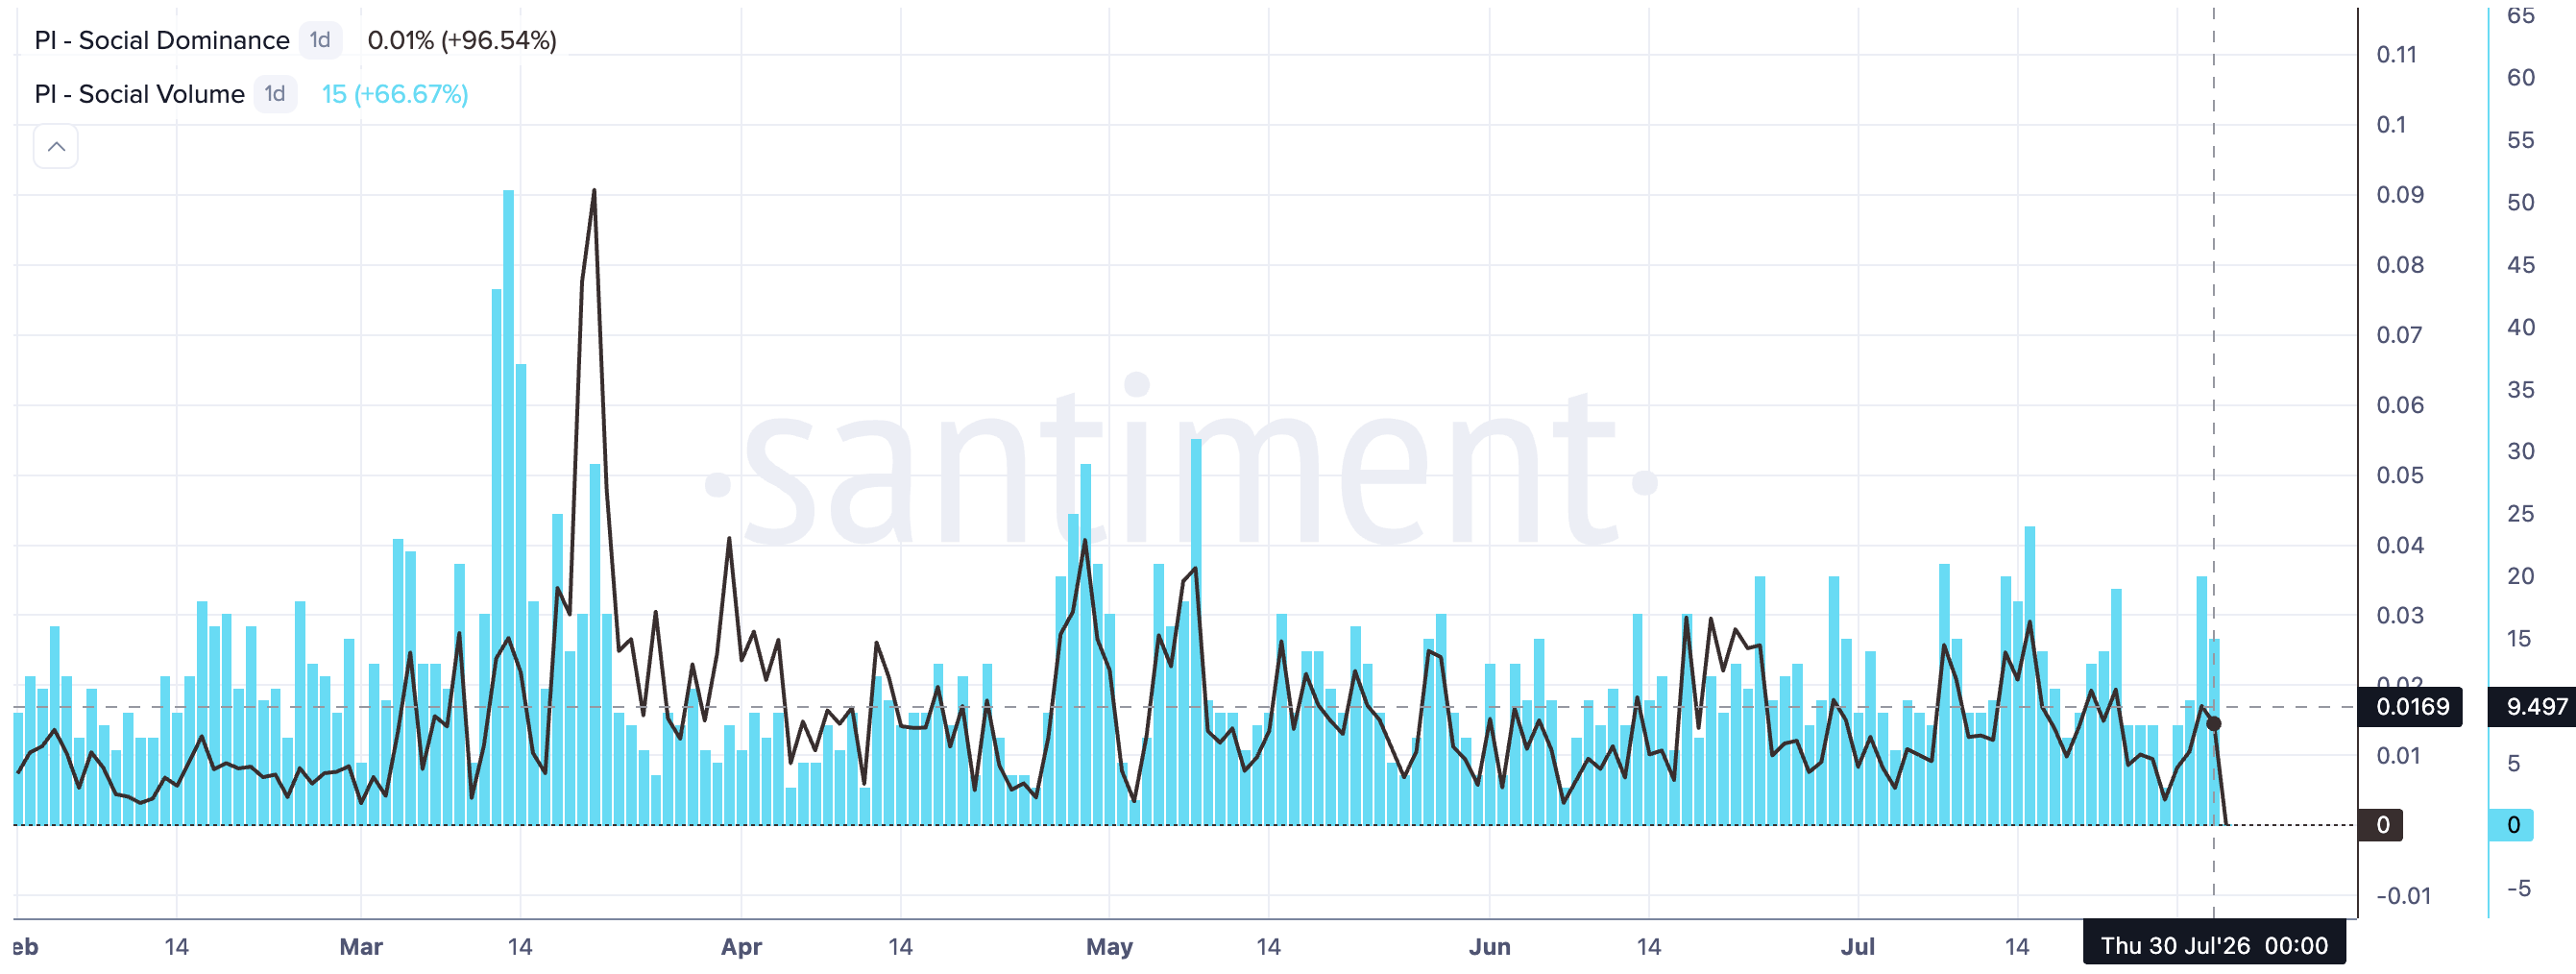
Santiment data shows the Social Volume for PI dropped to 15 on Thursday, from 20 the previous day, while the Social Dominance halved to 0.010% from 0.020%. The social interest in PI remains relatively low compared to previous spikes in March and late April, which often align with buying pressure, reflecting its speculative nature.
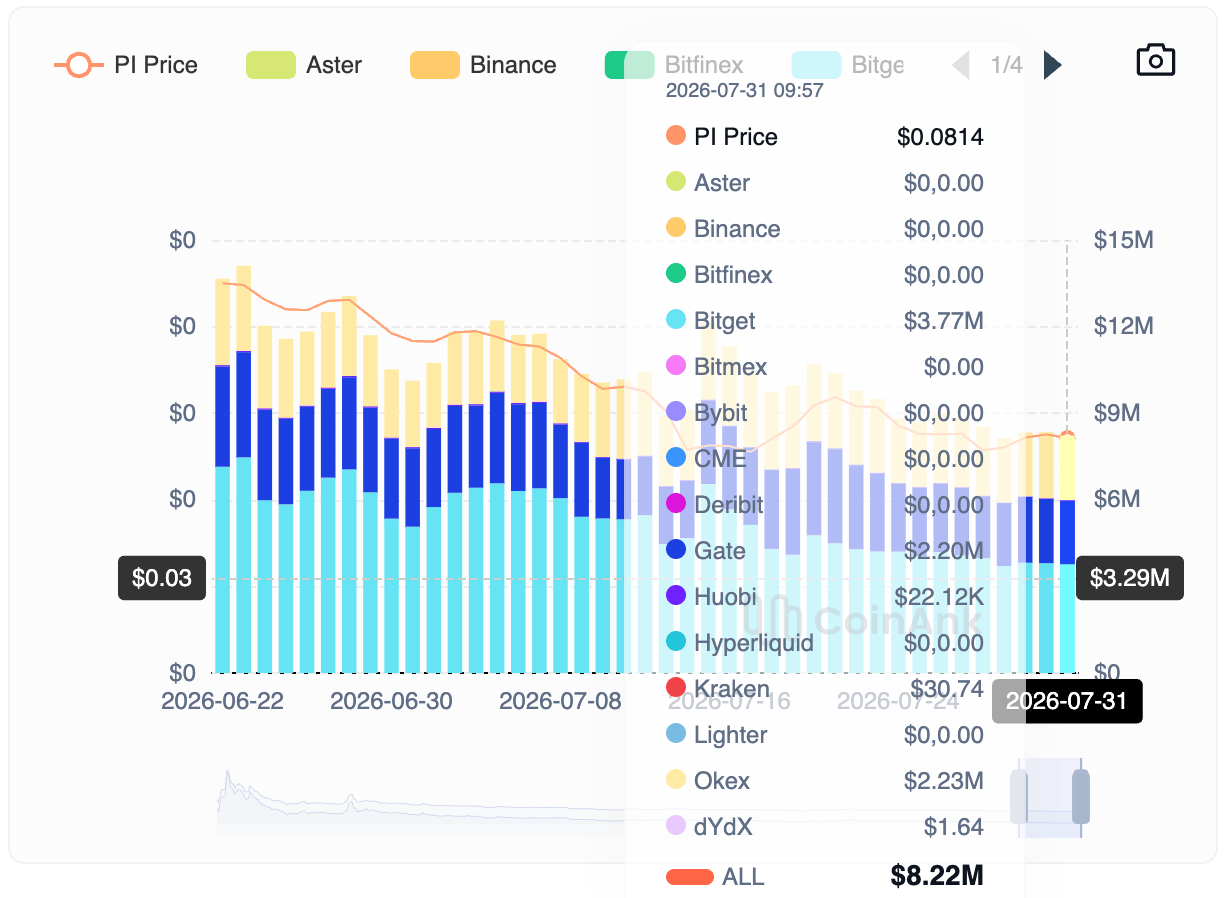
CoinAnk data shows a decline in PI Open Interest, down to $8.22 million on Friday from $12.14 million on July 15, reaffirming a reduction in speculative demand for the Pi Network.
Technical outlook: Will PI extend its recovery?
Pi Network maintains a bearish near-term tone, with price trapped in a falling channel pattern on the daily chart. The rebound in PI reflects firm buying pressure, holding the $0.0700 support level.
Momentum stays fragile with the Relative Strength Index (RSI) at 37, recovering from the oversold zone. At the same time, the Moving Average Convergence Divergence (MACD) rises above its signal line, hinting more at consolidation rather than a decisive recovery.
On the topside, initial resistance is seen at the 127.2% extension level, measured from $0.11998 to $0.1183, at $0.0961, which previously capped recovery on July 20.
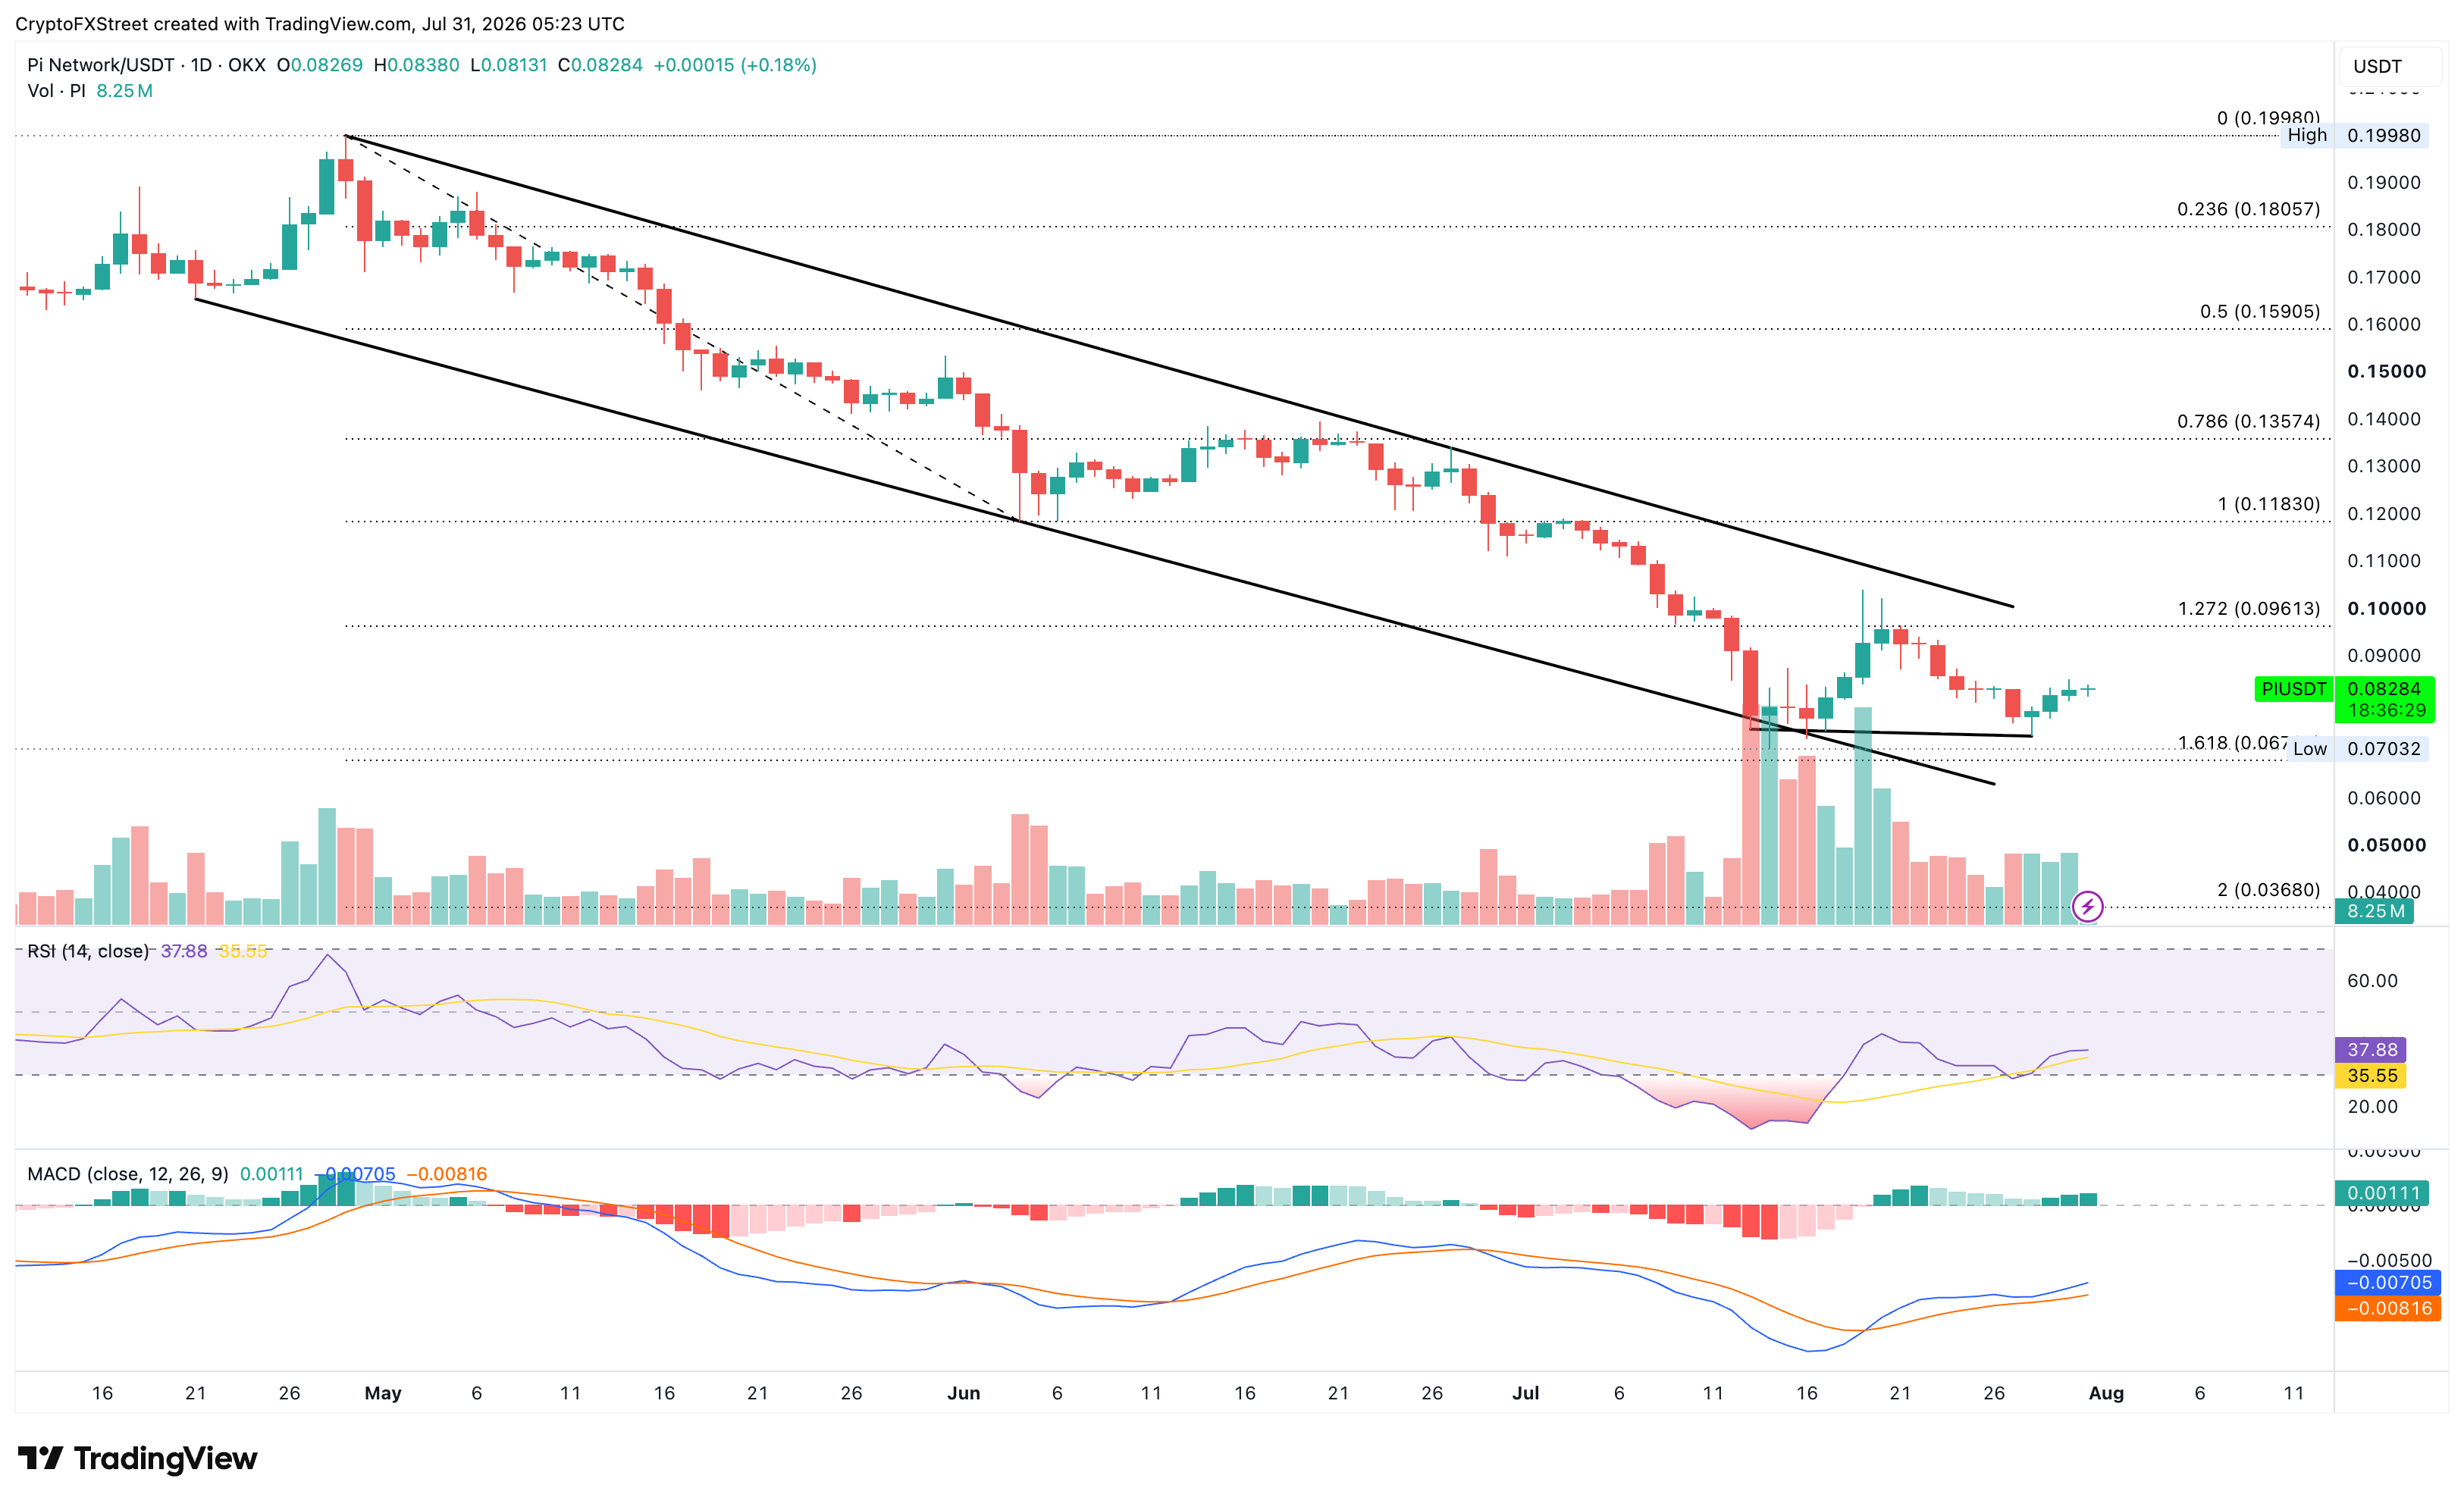
Looking down, the $0.0700 zone remains crucial support, guarding against a new record low and potentially targeting the 161.8% Fibonacci extension level at $0.0368.
(The technical analysis of this story was written with the help of an AI tool. Know more.)














