Pi Network Price Forecast: PI declines further, risking fresh record lows
Oleh Vishal Dixit
Diperbarui: 28 Jul 2026


ARTIKEL POPULER

Pi Network (PI) price is trading in the red on Tuesday, extending losses after a 7% decline the previous day. The PI token faces intense downside pressure as broader crypto market sentiment deteriorates, risking a steeper decline below the record low of $0.0700.
- Pi Network extends losses on Tuesday, following a roughly 7% decline the previous day.
- Crypto market sentiment deteriorates, weighing on community-driven tokens.
- The technical outlook for PI is bearish, with next support at the $0.0700 record low.
Pi Network (PI) price is trading in the red on Tuesday, extending losses after a 7% decline the previous day. The PI token faces intense downside pressure as broader crypto market sentiment deteriorates, risking a steeper decline below the record low of $0.0700.
Pi Network risks further downside as the crypto market sentiment declines
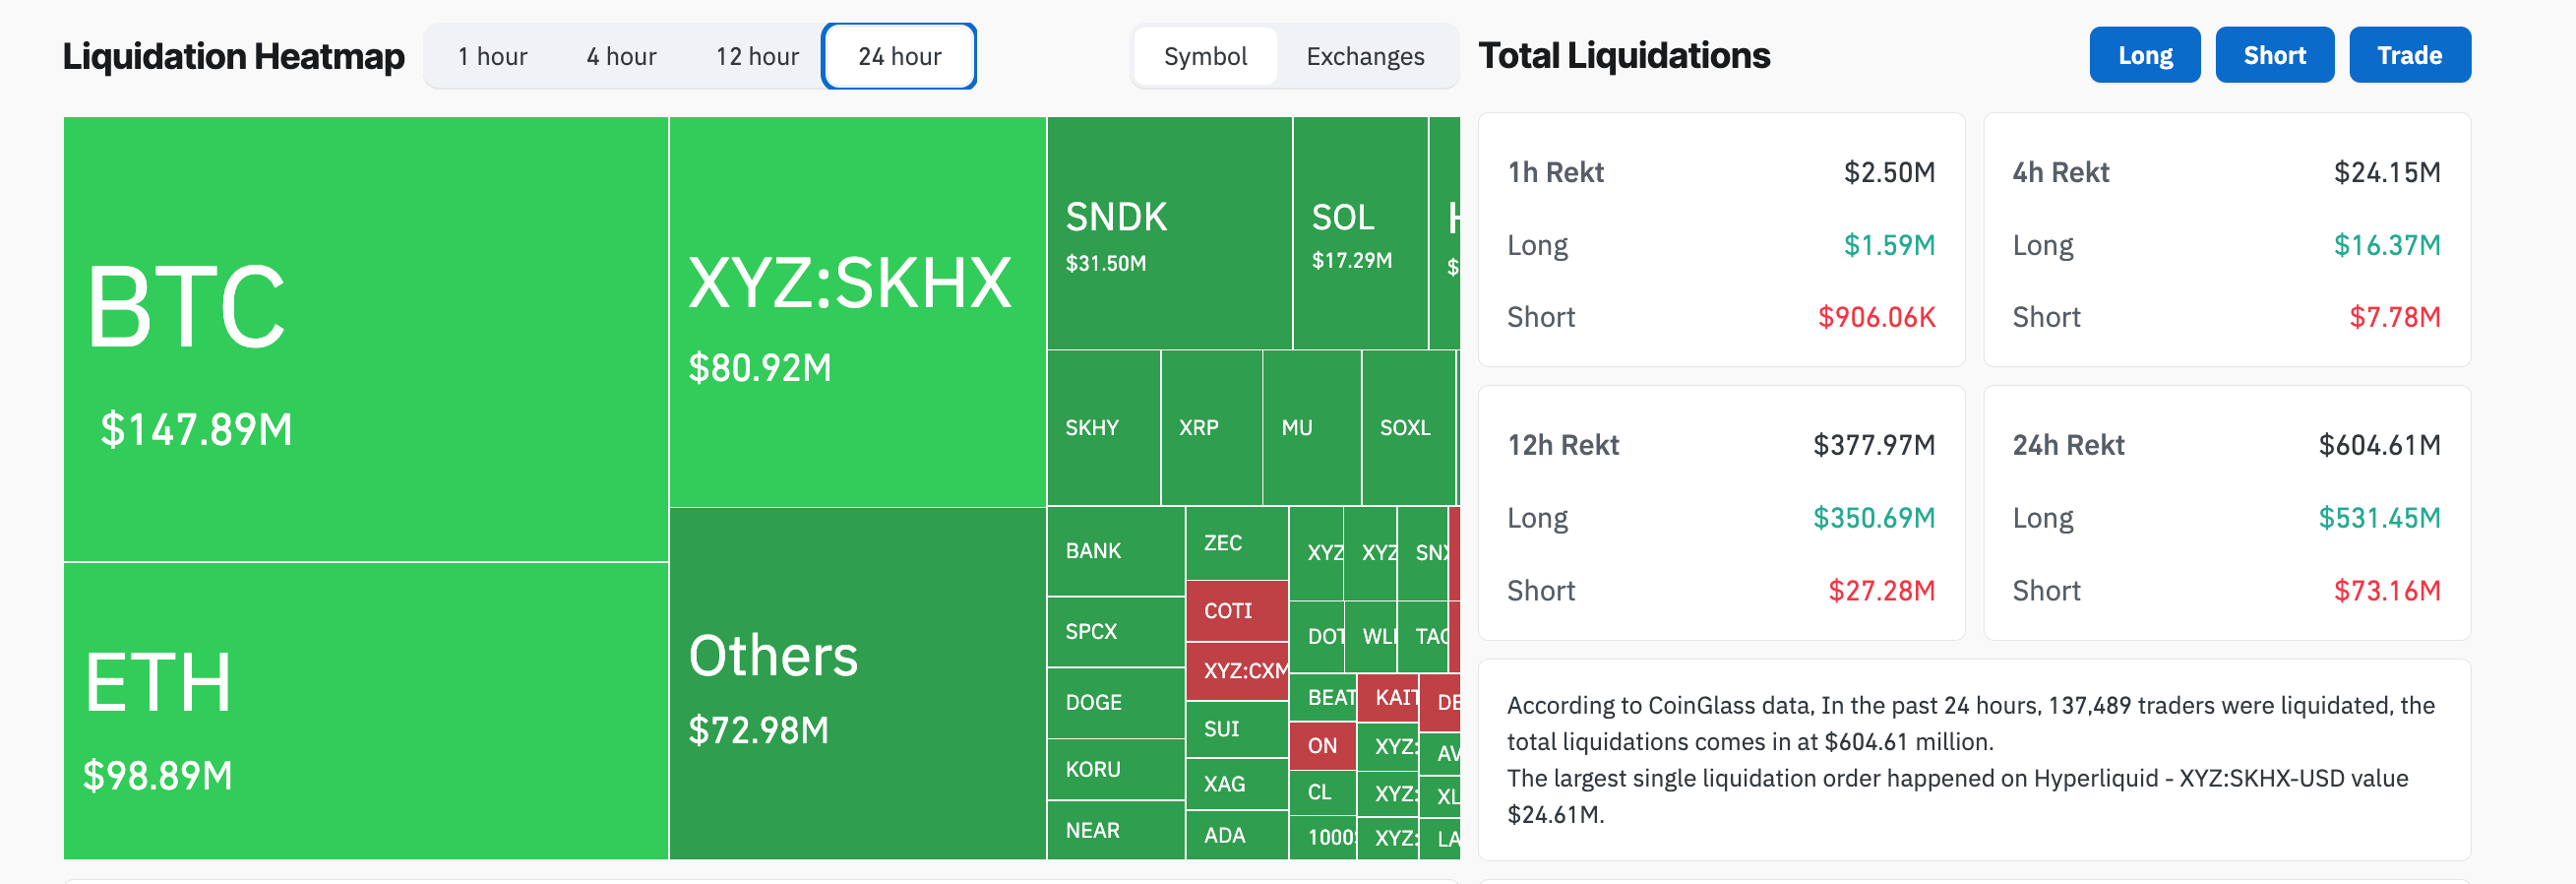
The broader crypto market faces renewed selling pressure this week. CoinGlass data shows $604 million in total liquidation, led by $531 million of long liquidation, reflecting a sell-side bias.
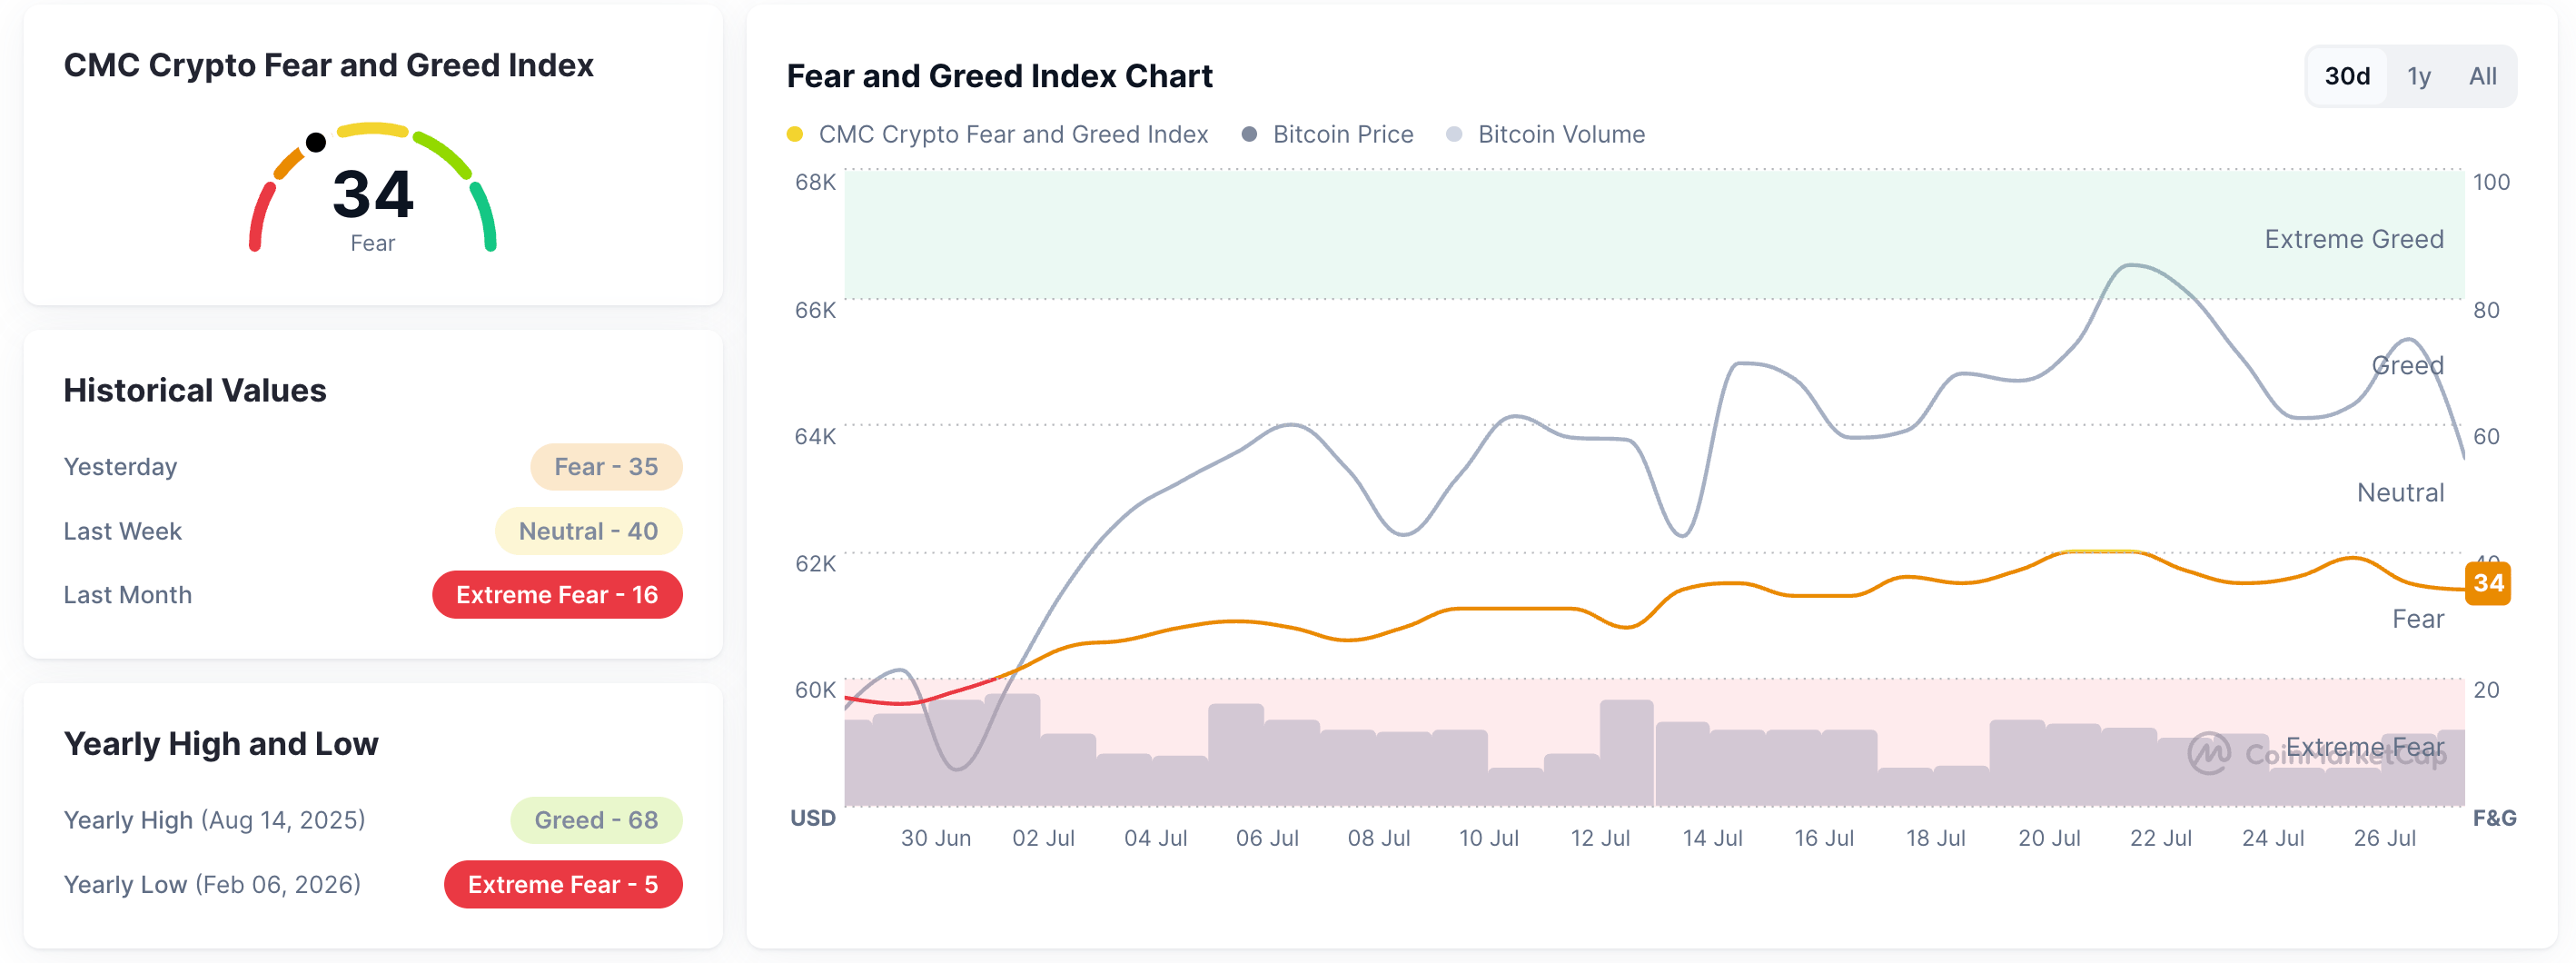
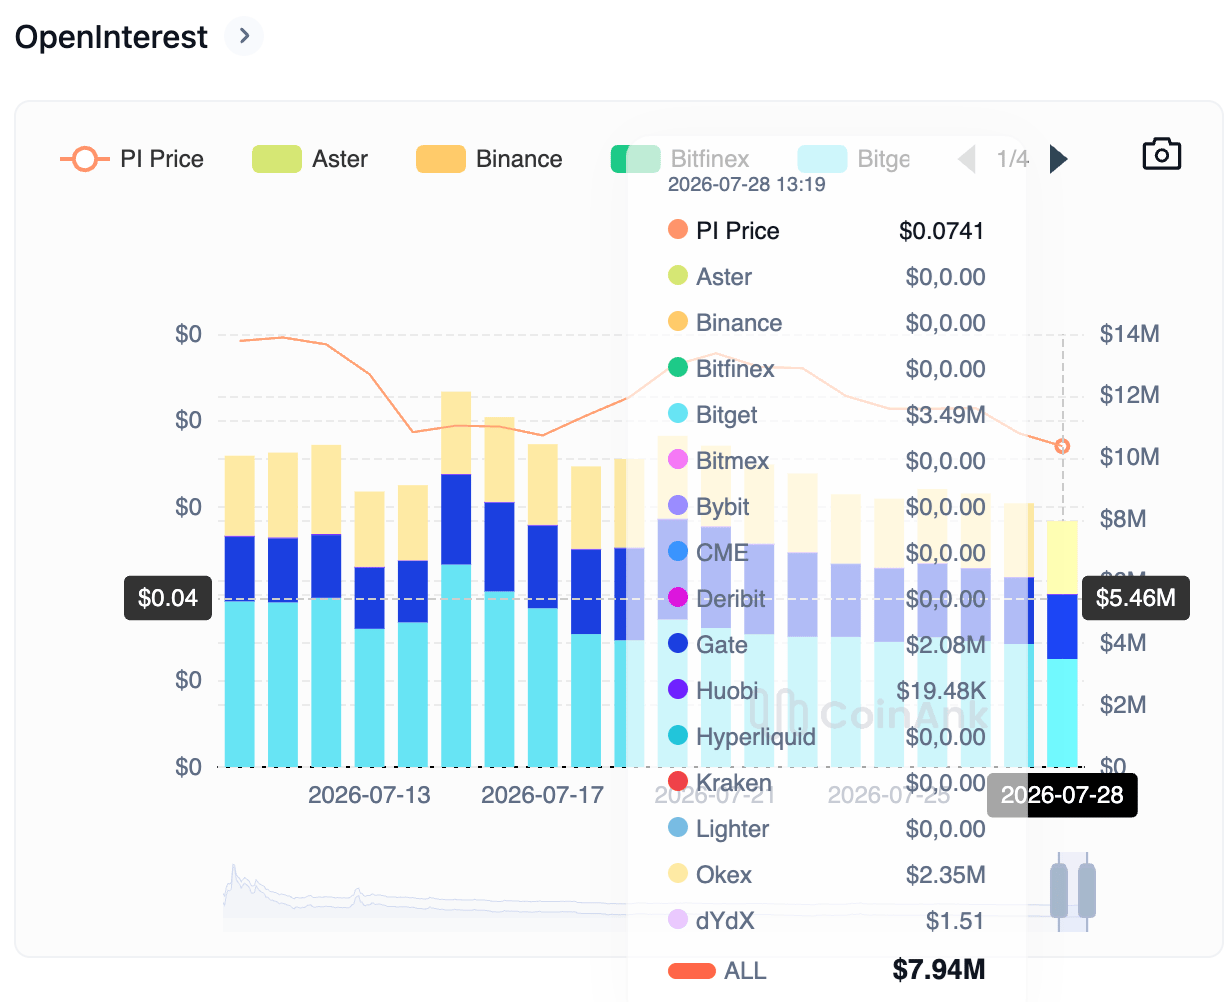
At the same time, CoinMarketCap’s Fear and Greed Index is at 34, down from 39 on Sunday as the market sentiment shifts risk-off from neutral. Given the strong correlation between the PI token and crypto market sentiment, risk-off conditions increase downside risk. CoinAnk data show a steady decline in PI Open Interest (OI) to $7.94 million, down from $12.14 million on July 15.
How low will Pi Network go?
Pi Network maintains a bearish near-term bias as price remains well below the 50- and 200-day Exponential Moving Averages (EMAs) at $0.1064 and $0.1719, respectively. From a technical perspective, PI has been trending downward within a falling channel pattern on the daily chart for roughly three months.
The PI token has shown a steady decline over the last week, approaching its recent low of $0.0700. A sustained close below this level could target the 200% Fibonacci extension level at $0.0368, measured from $0.1998 to $0.1183.
The Directional Movement Index shows a widening gap between the negative and positive DI lines, while the ADX line stabilizes near 39, hinting at renewed momentum.
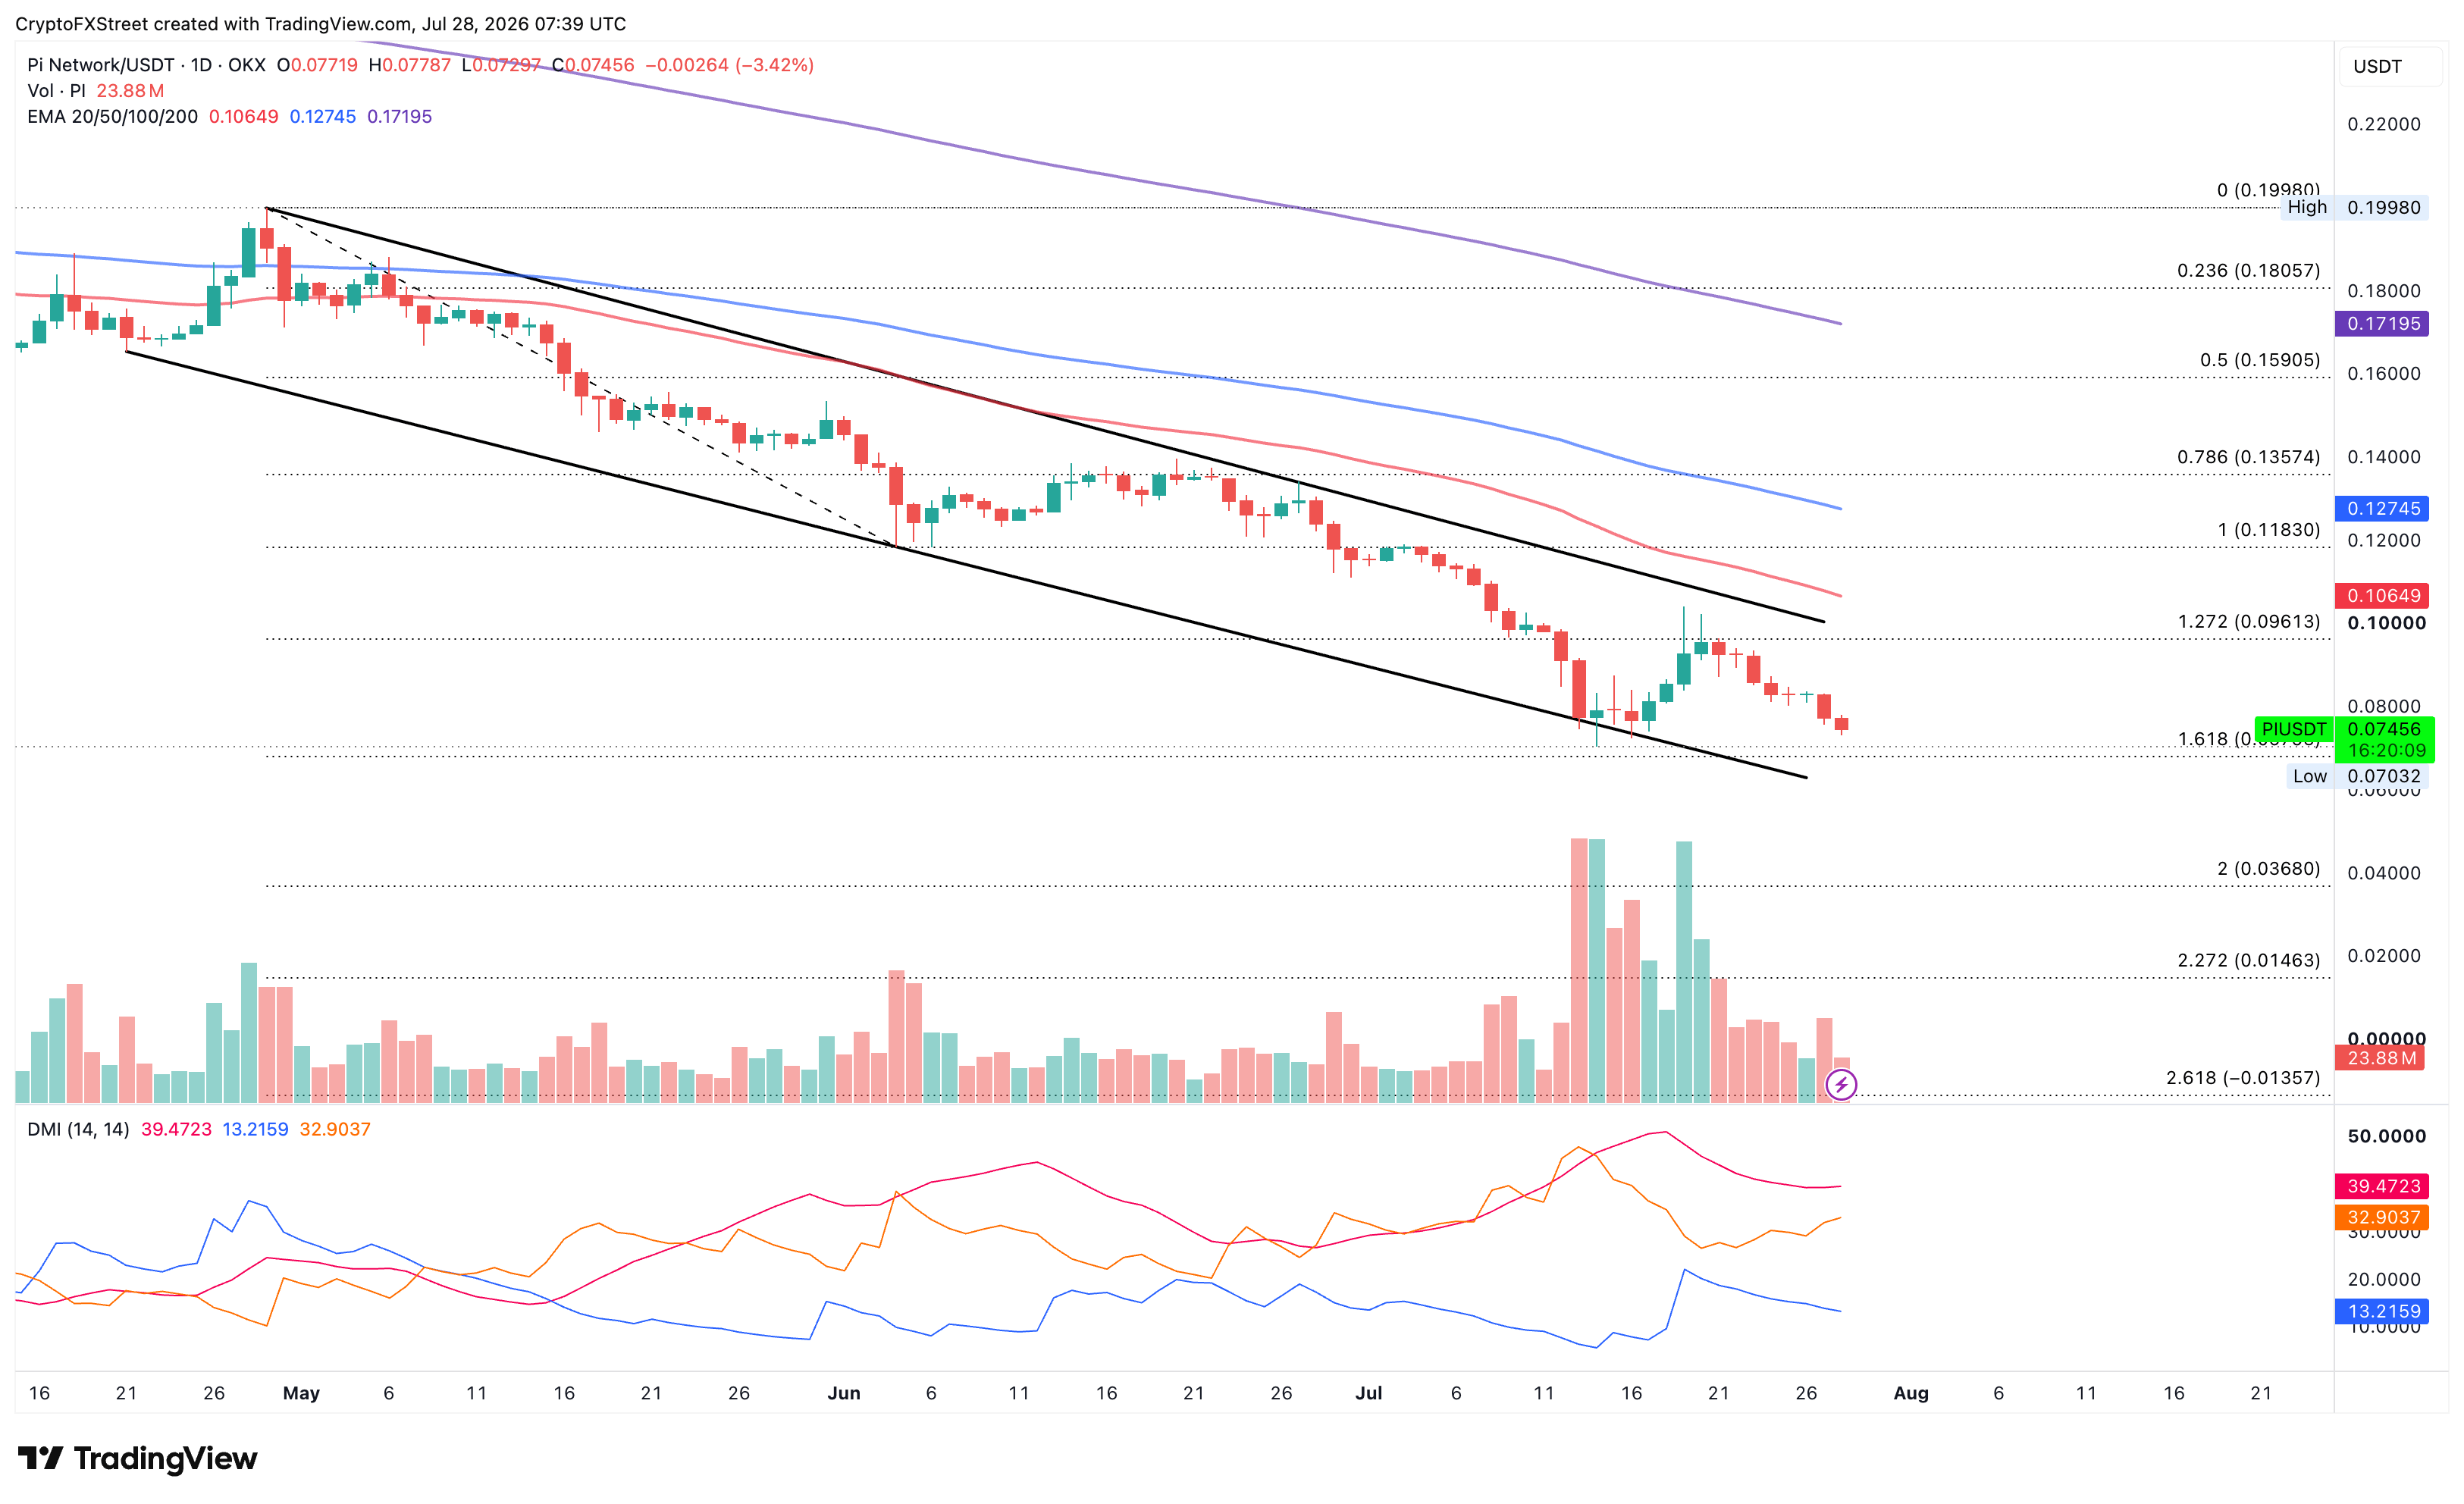
On the topside, initial resistance is located at the 127.2% Fibonacci extension level at $0.0961, followed by the overhead trendline near the $0.1000 psychological mark.
(The technical analysis of this story was written with the help of an AI tool. Know more.)

Lebih dari satu juta pengguna mengandalkan FXStreet untuk data pasar real-time, alat charting, wawasan ahli, dan berita forex. Kalender ekonomi komprehensif dan webinar edukatif membantu trader tetap mendapat informasi dan membuat keputusan terukur. FXStreet memiliki sekitar 60 profesional yang tersebar antara kantor pusat Barcelona dan berbagai wilayah global.
Baca Selengkapnya