




XRP Price Forecast: XRP nears critical $1.00 support
- XRP approaches the $1.00 lifeline support amid a predominantly weak technical outlook.
- XRP whales continue to increase their holdings despite the token’s persistent sell-off.
- XRP’s technical structure remains weak, with strong supply zones and deteriorating momentum indicators.
Ripple (XRP) remains pressured on Friday, trading around $1.03 at the time of writing. The token appears to hold this current level as support but lacks a catalyst to sustain a knee-jerk rebound toward the next key resistance at $1.10.
XRP whales increasing holdings

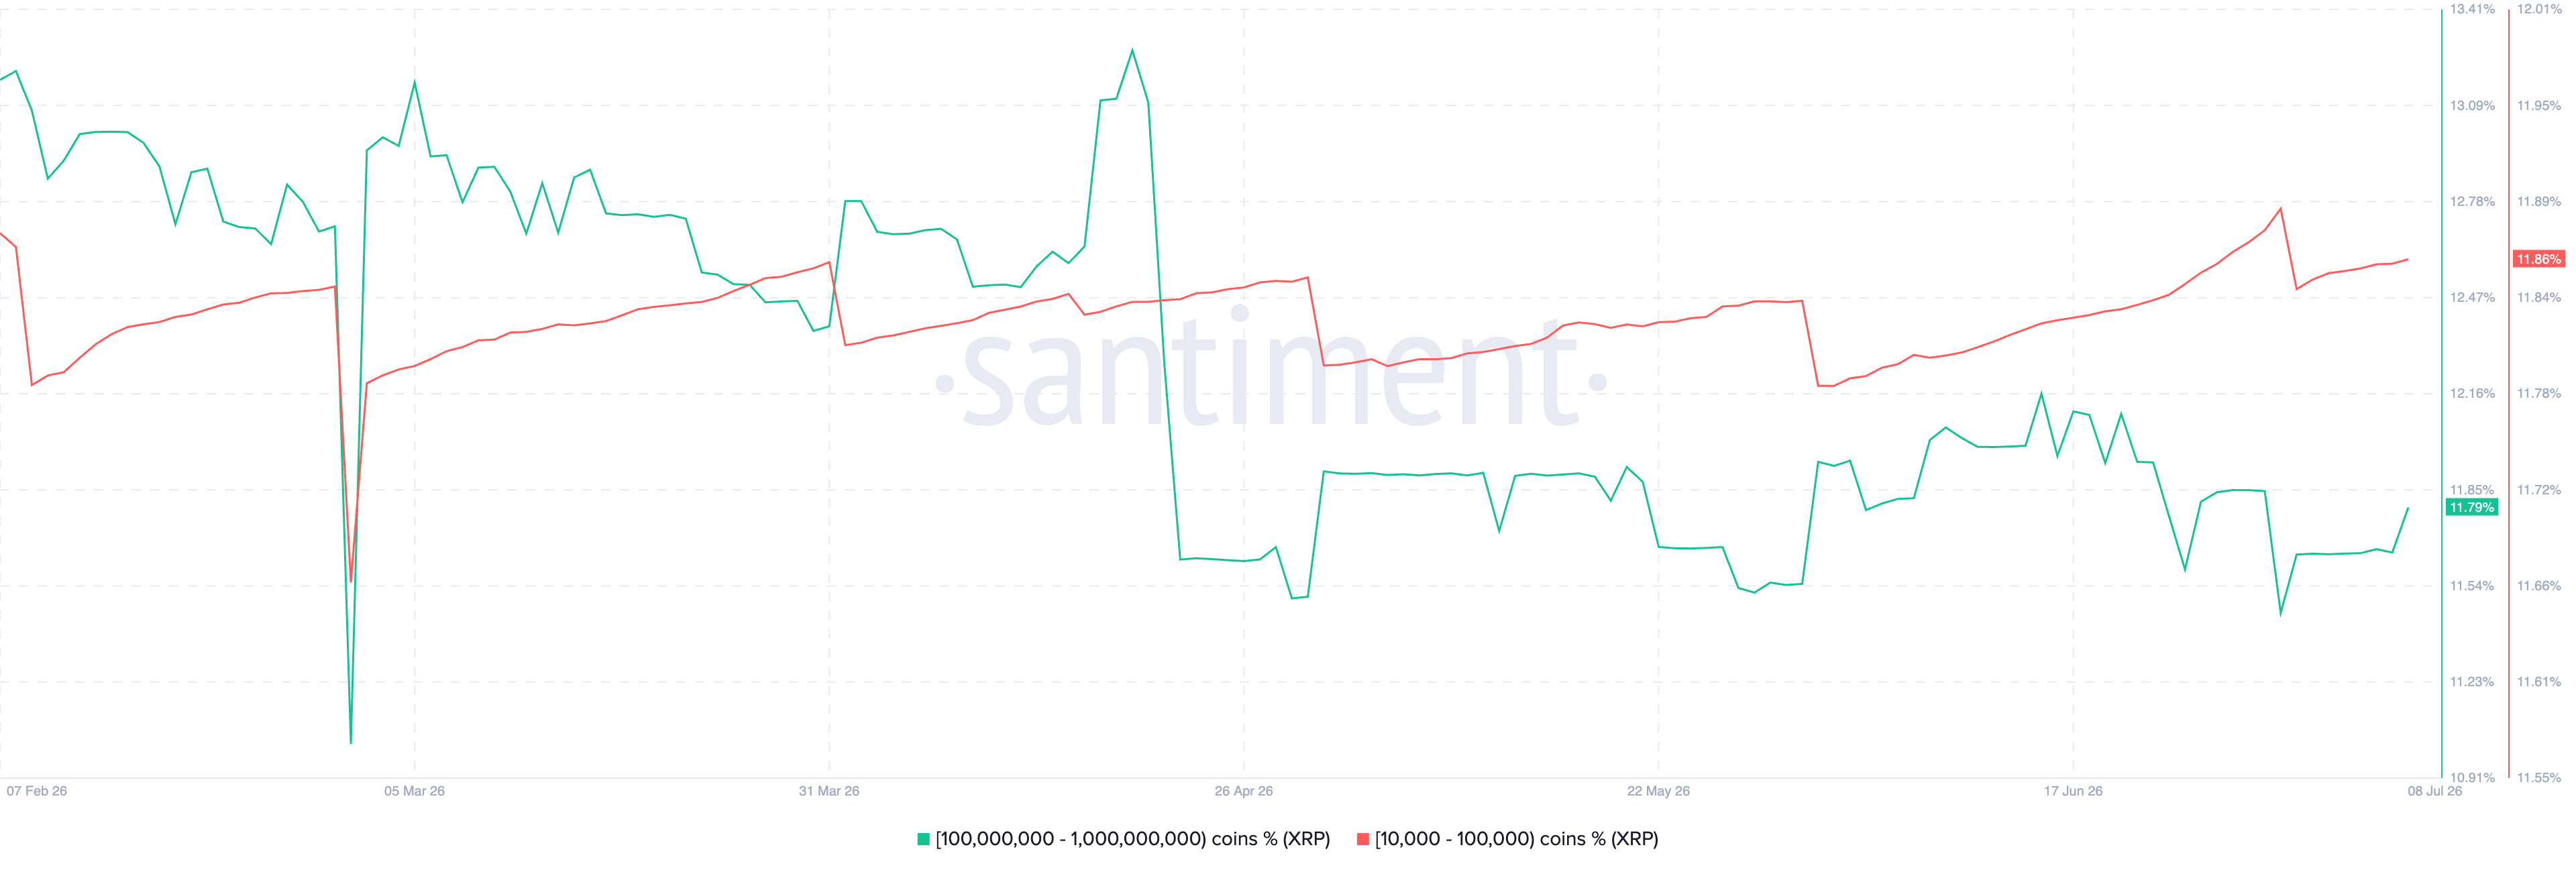
Whale accumulation on the XRP Ledger (XRPL) is accelerating, with the number of wallets holding between 100 million and 1 billion XRP rising sharply to represent 11.79%% of the circulating supply as of Friday, up from 11.65% the day before.
Investors with between 10,000 and 100,000 XRP are also stacking the token despite the ongoing selling. According to Santiment, this cohort of whales holds 11.86% of the circulating supply so far on Friday. Continued risk-on behavior could drive increased demand, effectively offsetting selling pressure and supporting a sustained market recovery.
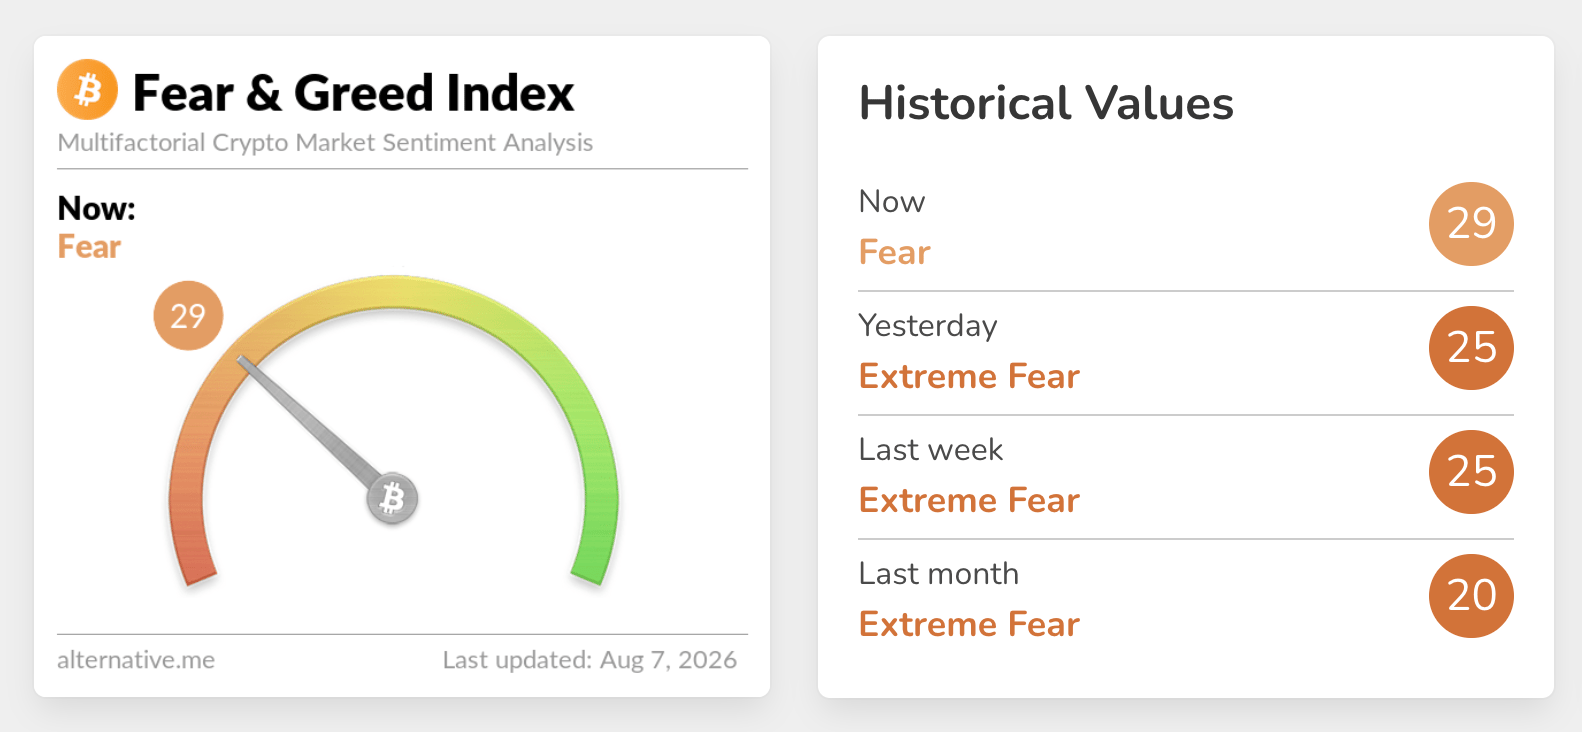
Meanwhile, risk appetite has improved but only marginally, with sentiment currently in the Fear territory at 29, up from 25 in the Extreme Fear territory on Thursday, according to the Fear & Greed Index. If sustained, strong sentiment would mean risk assets are attractive to investors, thus raising the odds of a sustained recovery.
Technical analysis: XRP retains a broad bearish outlook
XRP trades at $1.03, keeping a clear bearish near-term bias as price holds beneath the downward resistance trendline at $1.06 and all key Exponential Moving Averages (EMAs). The 50-day EMA at $1.11, clustered with the SuperTrend line at $1.11, reinforces the notion of overhead supply, while the 100-day and 200-day EMAs at $1.19 and $1.39, respectively, frame a broader downtrend.
Momentum remains weak, with the Relative Strength Index (RSI) hovering near 37 and the Moving Average Convergence Divergence (MACD) in negative territory and below its signal line, suggesting sellers retain control.
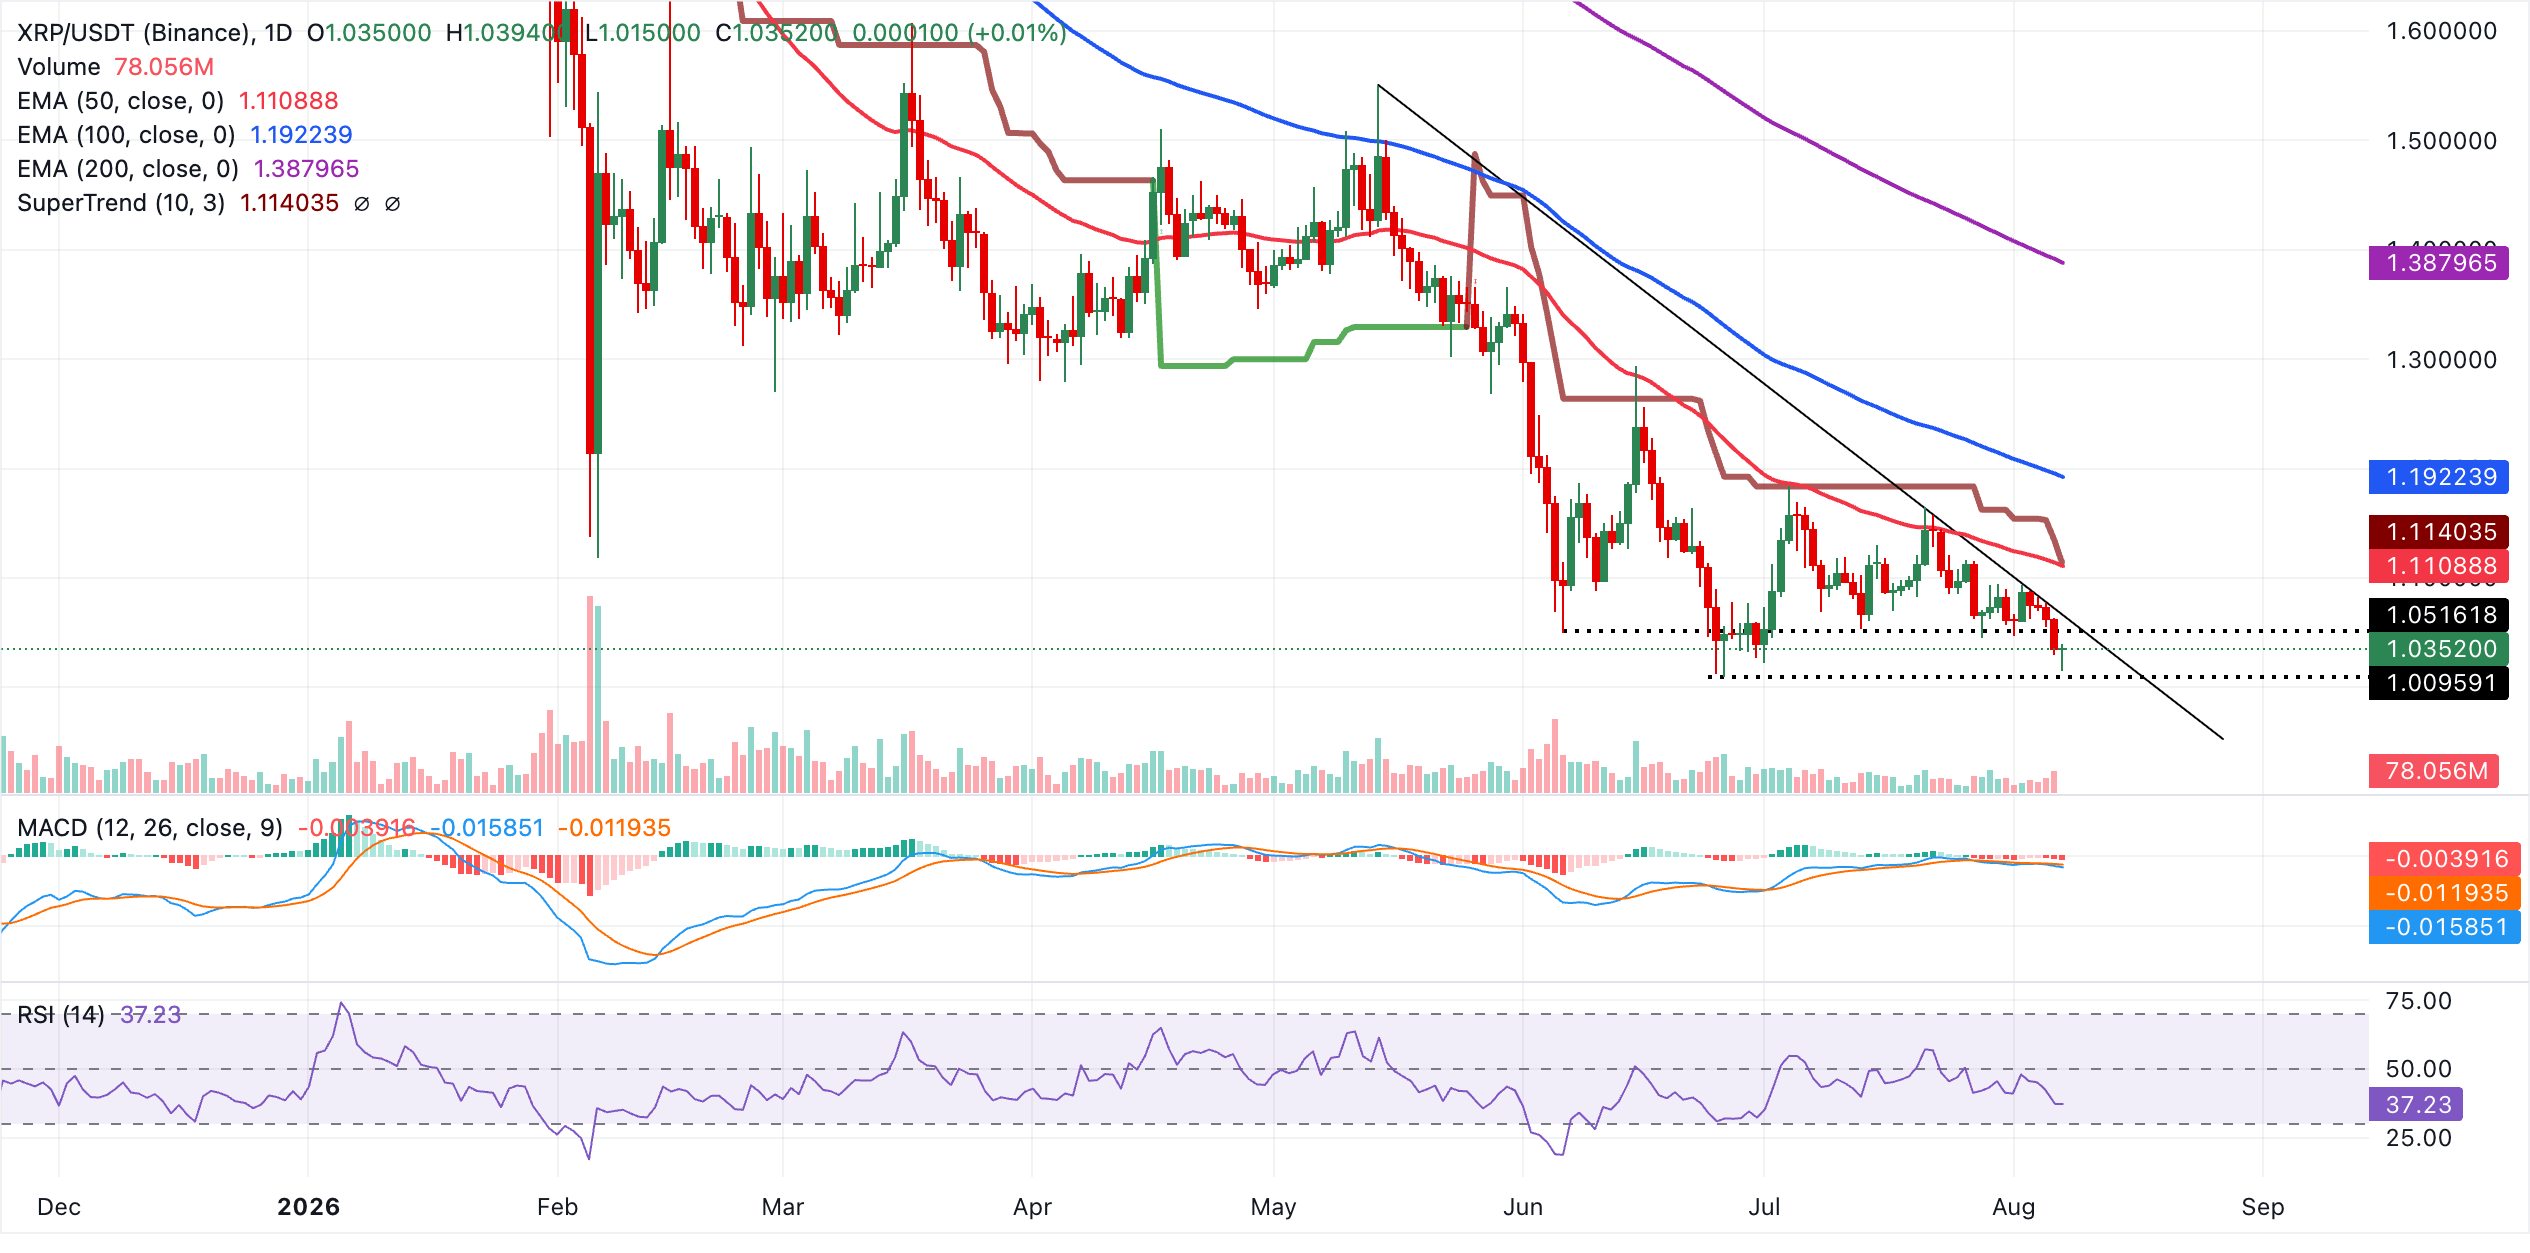
Initial resistance aligns at the former break area of the descending trendline around $1.06, followed by a dense technical ceiling around the 50-day EMA and the SuperTrend barrier at $1.11. Above that, the 100-day EMA at $1.19 is the next hurdle before the longer-term bearish structure defined by the 200-day EMA at $1.39 comes into play. Further declines would leave XRP searching for fresh demand zones at $1.00, unless buyers first reclaim the $1.06 region to ease immediate downside pressure.
(The technical analysis of this story was written with the help of an AI tool. Know more.)
Cryptocurrency metrics FAQs
The developer or creator of each cryptocurrency decides on the total number of tokens that can be minted or issued. Only a certain number of these assets can be minted by mining, staking or other mechanisms. This is defined by the algorithm of the underlying blockchain technology. On the other hand, circulating supply can also be decreased via actions such as burning tokens, or mistakenly sending assets to addresses of other incompatible blockchains.
Market capitalization is the result of multiplying the circulating supply of a certain asset by the asset’s current market value.
Trading volume refers to the total number of tokens for a specific asset that has been transacted or exchanged between buyers and sellers within set trading hours, for example, 24 hours. It is used to gauge market sentiment, this metric combines all volumes on centralized exchanges and decentralized exchanges. Increasing trading volume often denotes the demand for a certain asset as more people are buying and selling the cryptocurrency.
Funding rates are a concept designed to encourage traders to take positions and ensure perpetual contract prices match spot markets. It defines a mechanism by exchanges to ensure that future prices and index prices periodic payments regularly converge. When the funding rate is positive, the price of the perpetual contract is higher than the mark price. This means traders who are bullish and have opened long positions pay traders who are in short positions. On the other hand, a negative funding rate means perpetual prices are below the mark price, and hence traders with short positions pay traders who have opened long positions.













