




Top Altcoins Price Forecast: Ripple nears triangle breakout while Cardano, Hyperliquid rebound
- Ripple holds steady on Tuesday, approaching the apex of a symmetrical triangle pattern.
- Cardano nears $0.2000 following a steady recovery of over 25% in the last seven days.
- Hyperliquid edges higher for the third consecutive day, holding above its 200-day EMA at $50.78.
Ripple (XRP) trades above $1.00 on Tuesday, approaching the apex of a symmetrical triangle pattern. Cardano (ADA) and Hyperliquid (HYPE) hold steady, sustaining gains from the recent rebound. The technical outlook for XRP is mixed while ADA and HYPE maintain a bullish bias.

Technical outlook: XRP nears triangle pattern breakout
XRP maintains a mixed tone on the daily chart, trapped between two converging trendlines forming a symmetrical triangle pattern. At the time of writing, XRP trades above the rising support trend line around $1.0510, but the nearby downward resistance trend line at $1.1123, reinforced by the 50-day Exponential Moving Average (EMA) at $1.1194, suggests the price remains capped within a broader corrective structure.
The Relative Strength Index (RSI) near 45 remains in neutral territory with a slightly downward slope, while the Moving Average Convergence Divergence (MACD) edges higher to its signal line, hinting at a potential bullish crossover.
A slip below the support trendline at $1.0510 could extend the decline below $1.000 toward the S2 Pivot level at $0.9945.
On the topside, initial resistance is seen at the descending trend line around $1.1123, followed closely by the 50-day EMA near $1.1194, forming a tight supply zone that bulls would need to clear to ease the current downside bias. A potential breakout could face resistance at the R1 Pivot level at $1.1568.
Technical outlook: ADA gains bullish momentum
Cardano extends a renewed bullish bias after reclaiming the 50-day EMA at roughly $0.1755 and breaking above the former downtrend resistance line, now turned support, near $0.1735. Price holds well below the 200-day EMA at about $0.2700, so the broader trend remains capped.
The firm RSI at 67 nears the overbought zone, while the rising MACD above its signal line suggests improving upside momentum. The path of least resistance for ADA remains upside, but price could face headwinds as it attempts to reclaim the February 6 low at $0.2250.
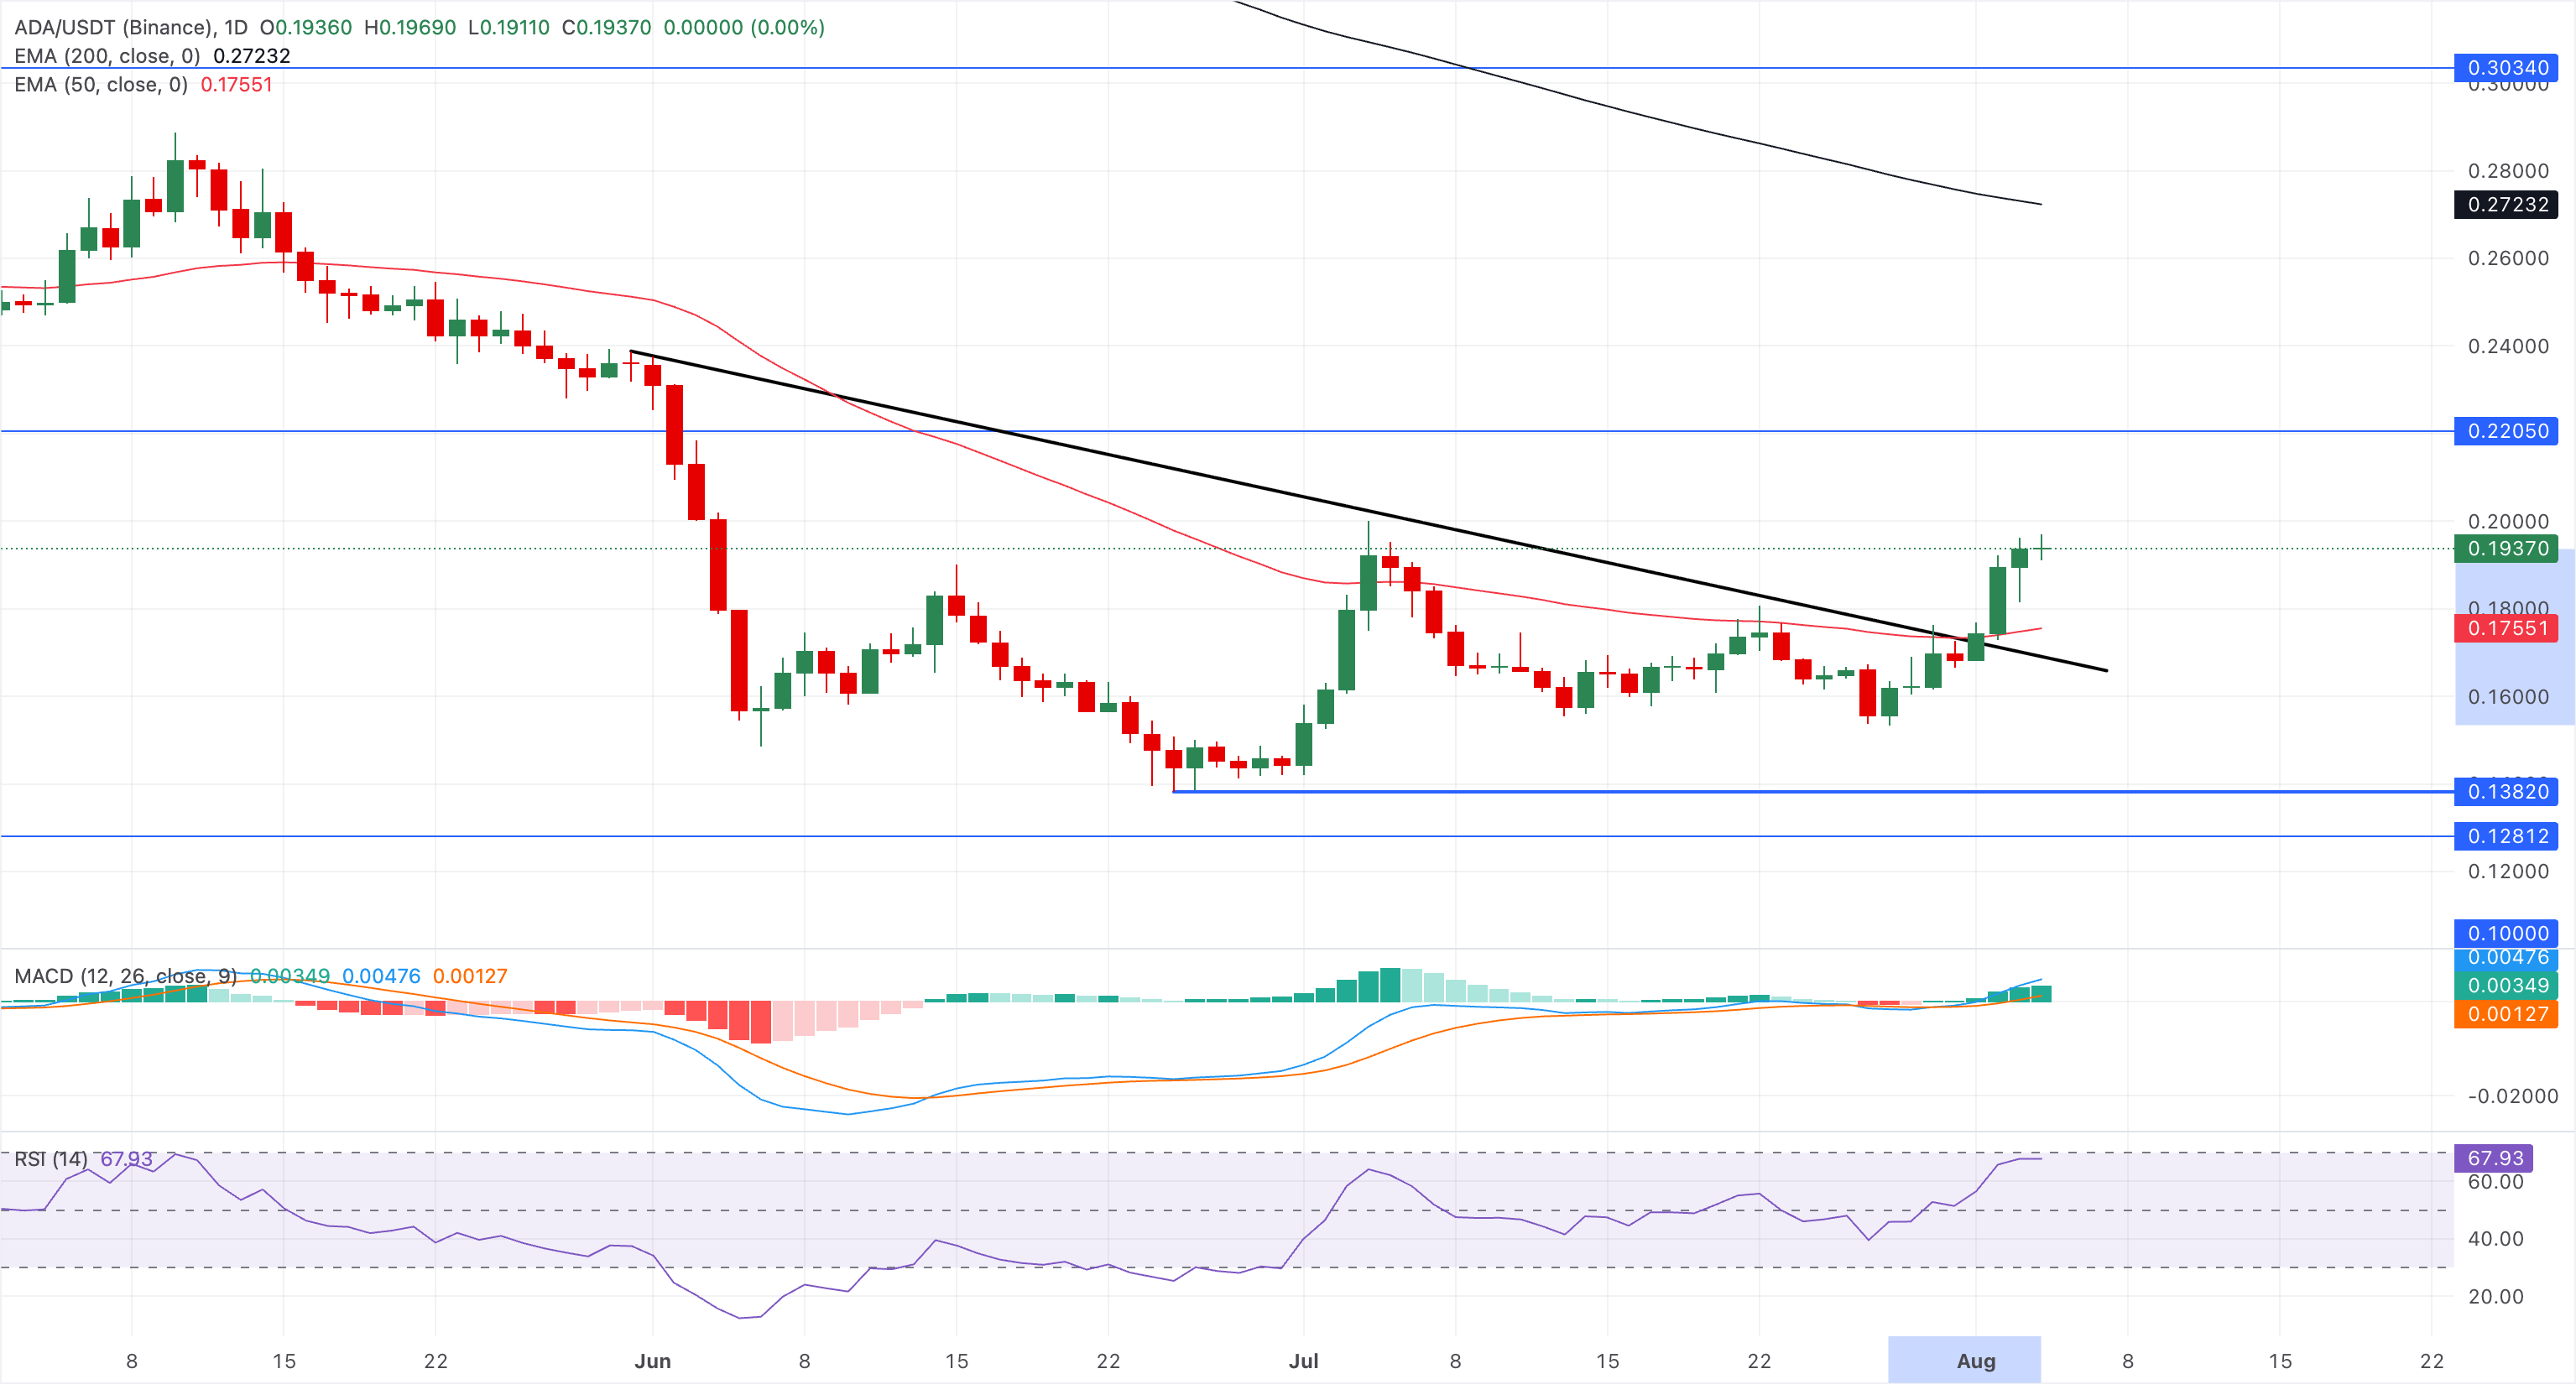
Looking down, initial support is seen at the 50-day EMA at $0.1755, reinforced by the former descending trendline around $0.1735.
Technical outlook: HYPE rebounds above $50
HYPE retains a bearish near-term bias, trading below the 50-day EMA at $59.58 but above the longer-term 200-day EMA at $50.78. The mild recovery above the 200-day EMA hints at a retest of the 50% retracement level, measured from the $38.17 low to the $76.93 high, at $57.55. For a sustained recovery, HYPE must reclaim the 50-day EMA at $59.58.
Downside momentum eases, with the MACD and signal line converging for a bullish crossover while the RSI around 39 shows a rebound before reaching oversold conditions.
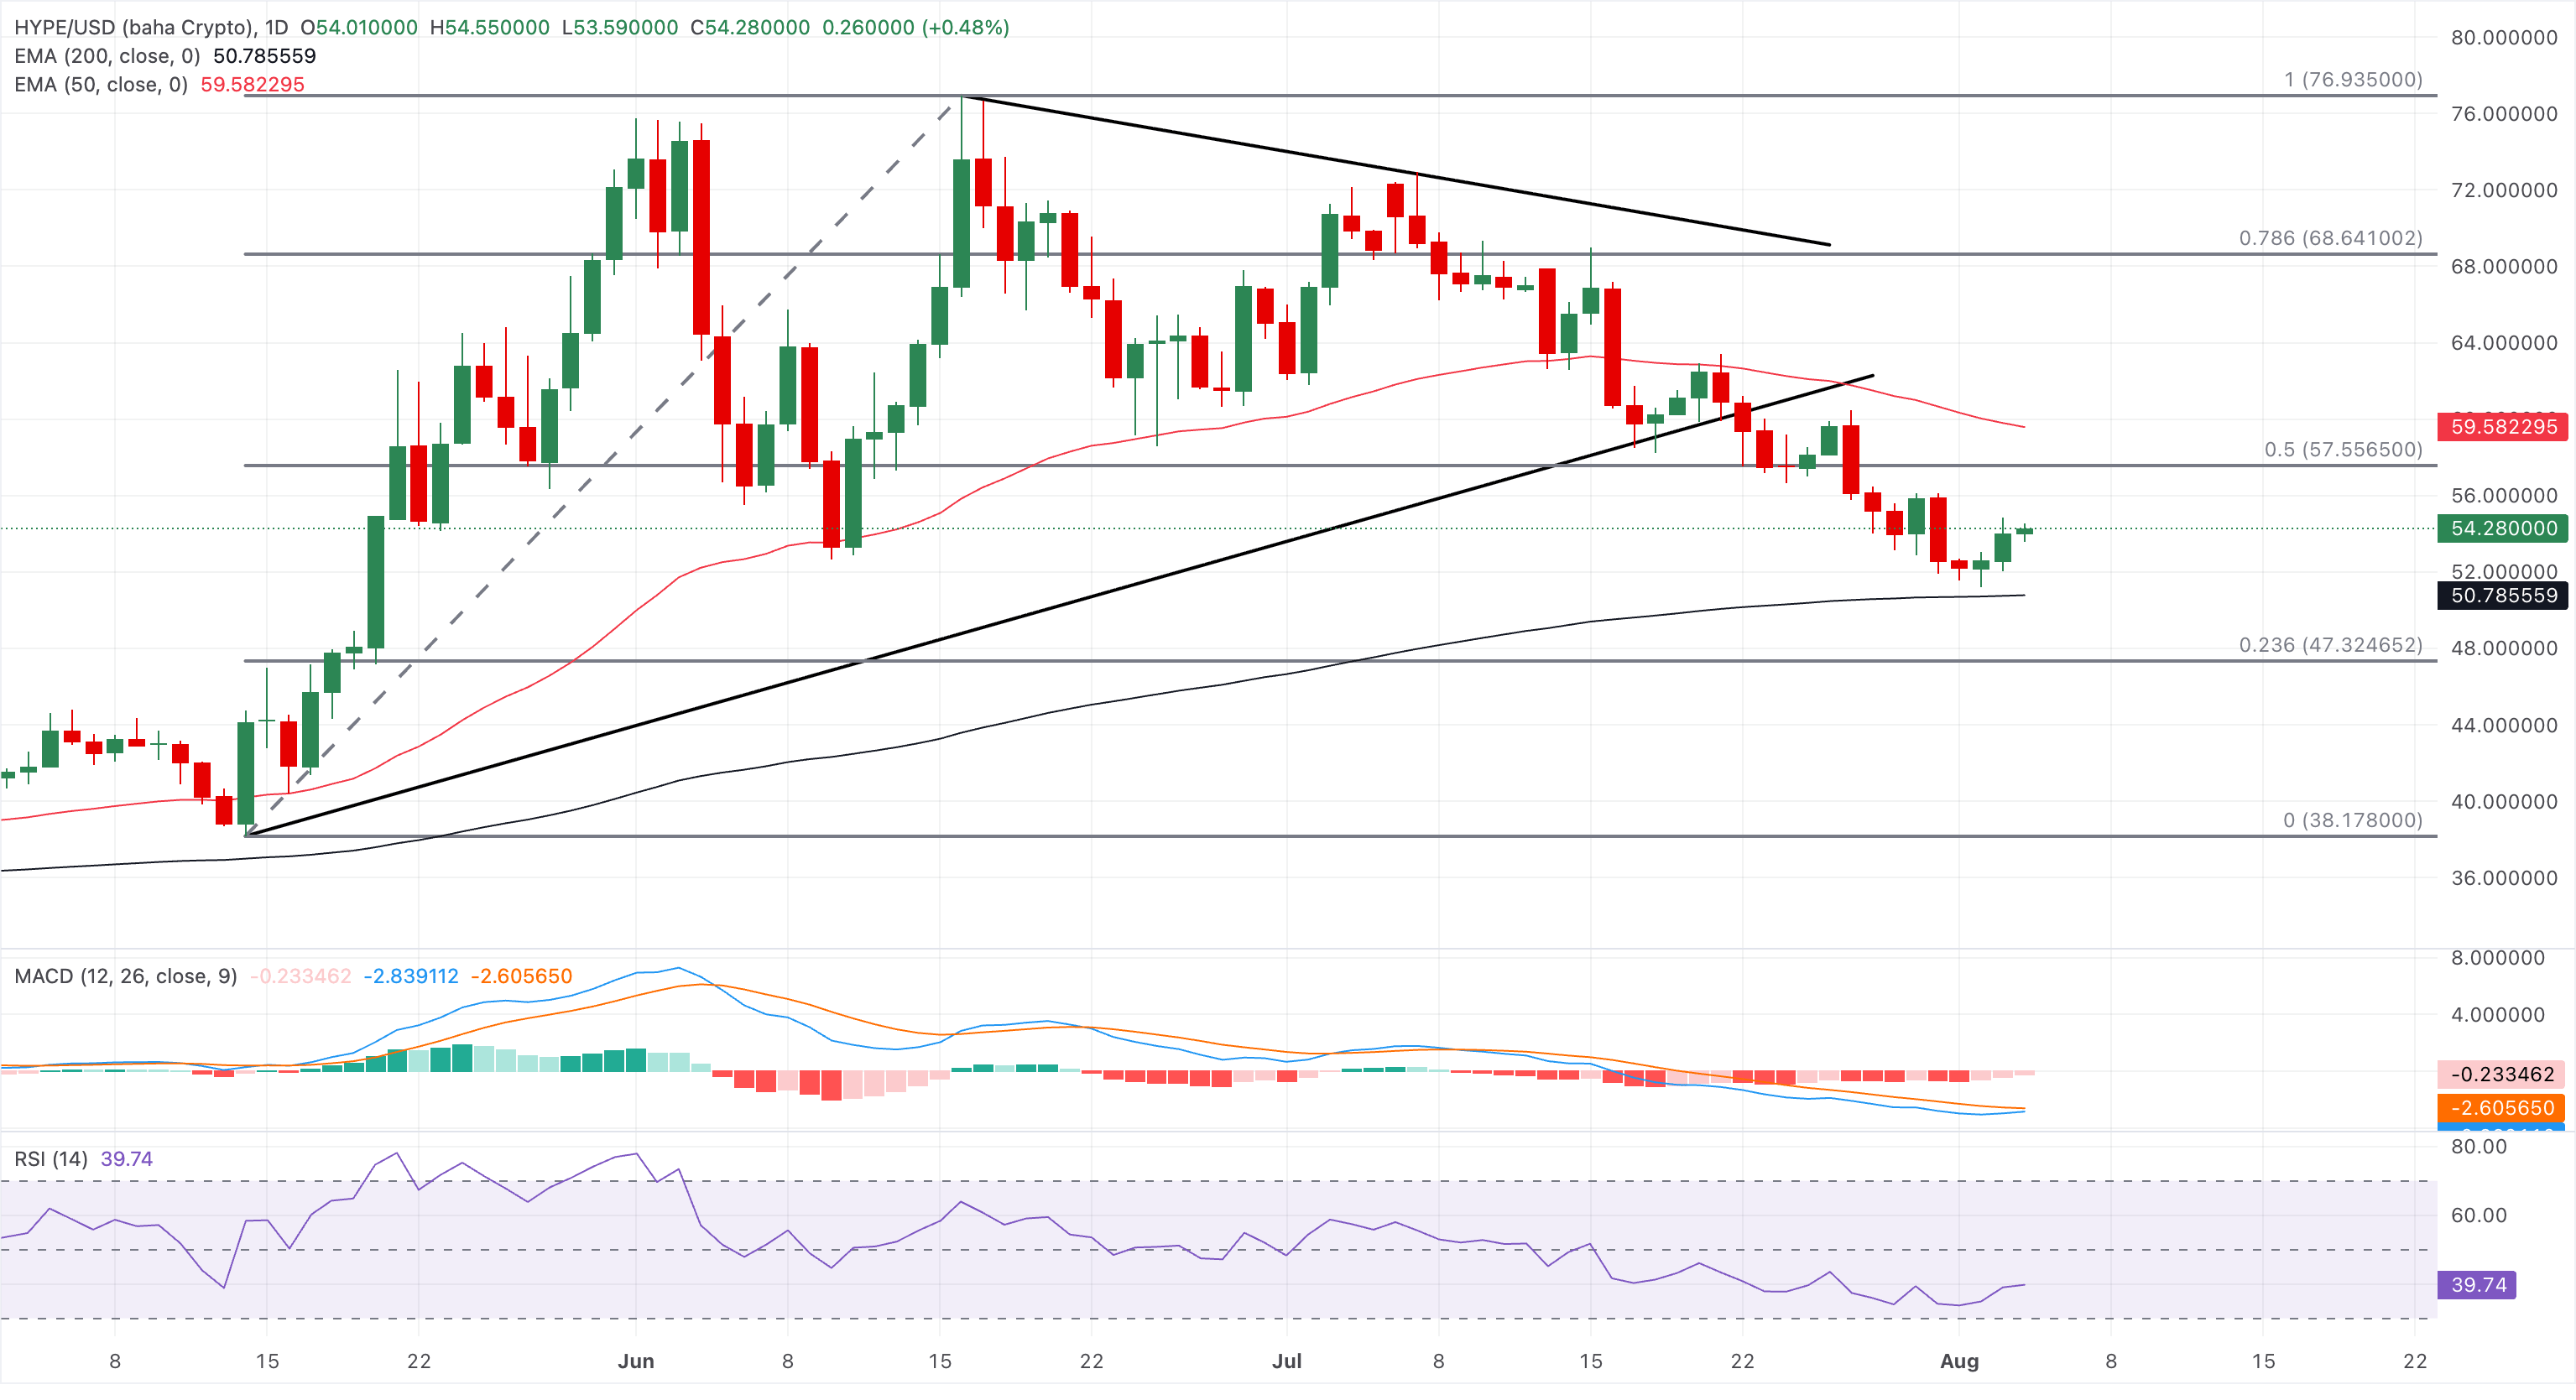
Initial support is located at the 200-day EMA around $50.79, with a deeper floor at the 23.6% Fibonacci retracement level at $47.32.
(The technical analysis of this story was written with the help of an AI tool. Know more.)













