

Pi Network Price Forecast: PI takes a breather despite improving market sentiment
- Pi Network falls 4% on Tuesday, snapping a streak of four consecutive days of gains.
- Crypto market sentiment improves slightly, with the Fear and Greed Index rising close to neutral levels.
- The technical outlook continues to suggest a broader-term downside bias as price forms a bearish channel pattern.
Pi Network (PI) edges lower by nearly 5% on Tuesday, breaking a streak of four consecutive days of recovery despite easing risk-off sentiment in the crypto market. The technical outlook for PI continues to suggest further downside as a bearish channel pattern remains intact.

Rising retail conviction overlooks PI token
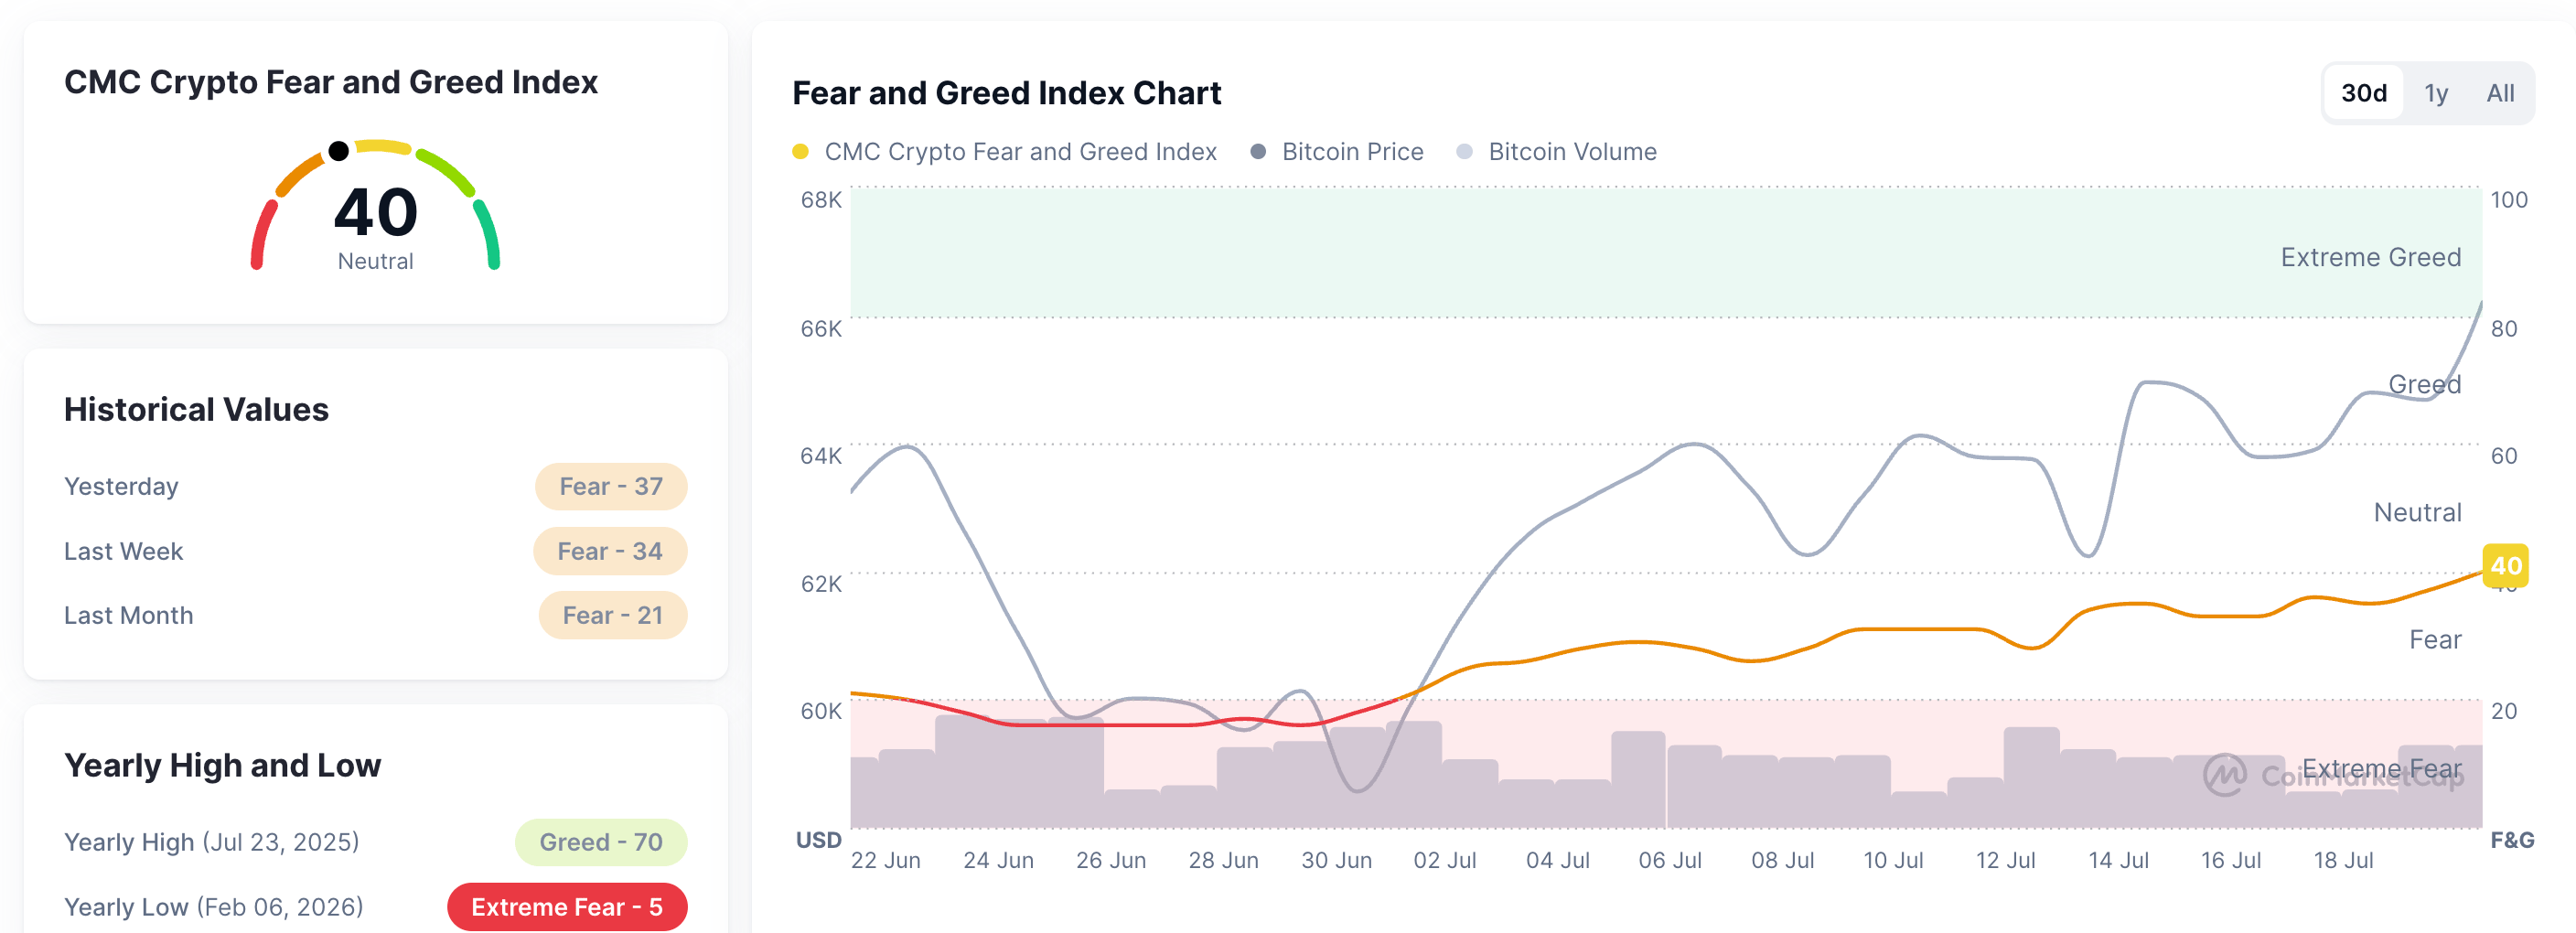
The broader cryptocurrency market witnesses improving investor risk appetite, with Bitcoin (BTC) topping $66,000 on Tuesday. CoinMarketCap’s Fear and Greed Index rises to 40, entering neutral from the fear zone. Typically, a broader market recovery lifts PI tokens, but a near-term deviation puts PI at greater downside risk.
Technical outlook: Will Pi Network lose its recent gains?
Pi Network is down nearly 5% on Tuesday, as the 127.2% Fibonacci extension level, measured from $0.19980 to $0.11830, at $0.09613, capped the four-day recovery run in PI. From a technical perspective, the PI token remains in a bearish trend with a falling channel pattern intact on the daily chart.
The Relative Strength Index (RSI) at 39 on the daily chart shows a downtick below the midline, indicating elevated selling pressure.
Looking down, the immediate support for PI is at the 161.8% Fibonacci extension level at $0.06793.
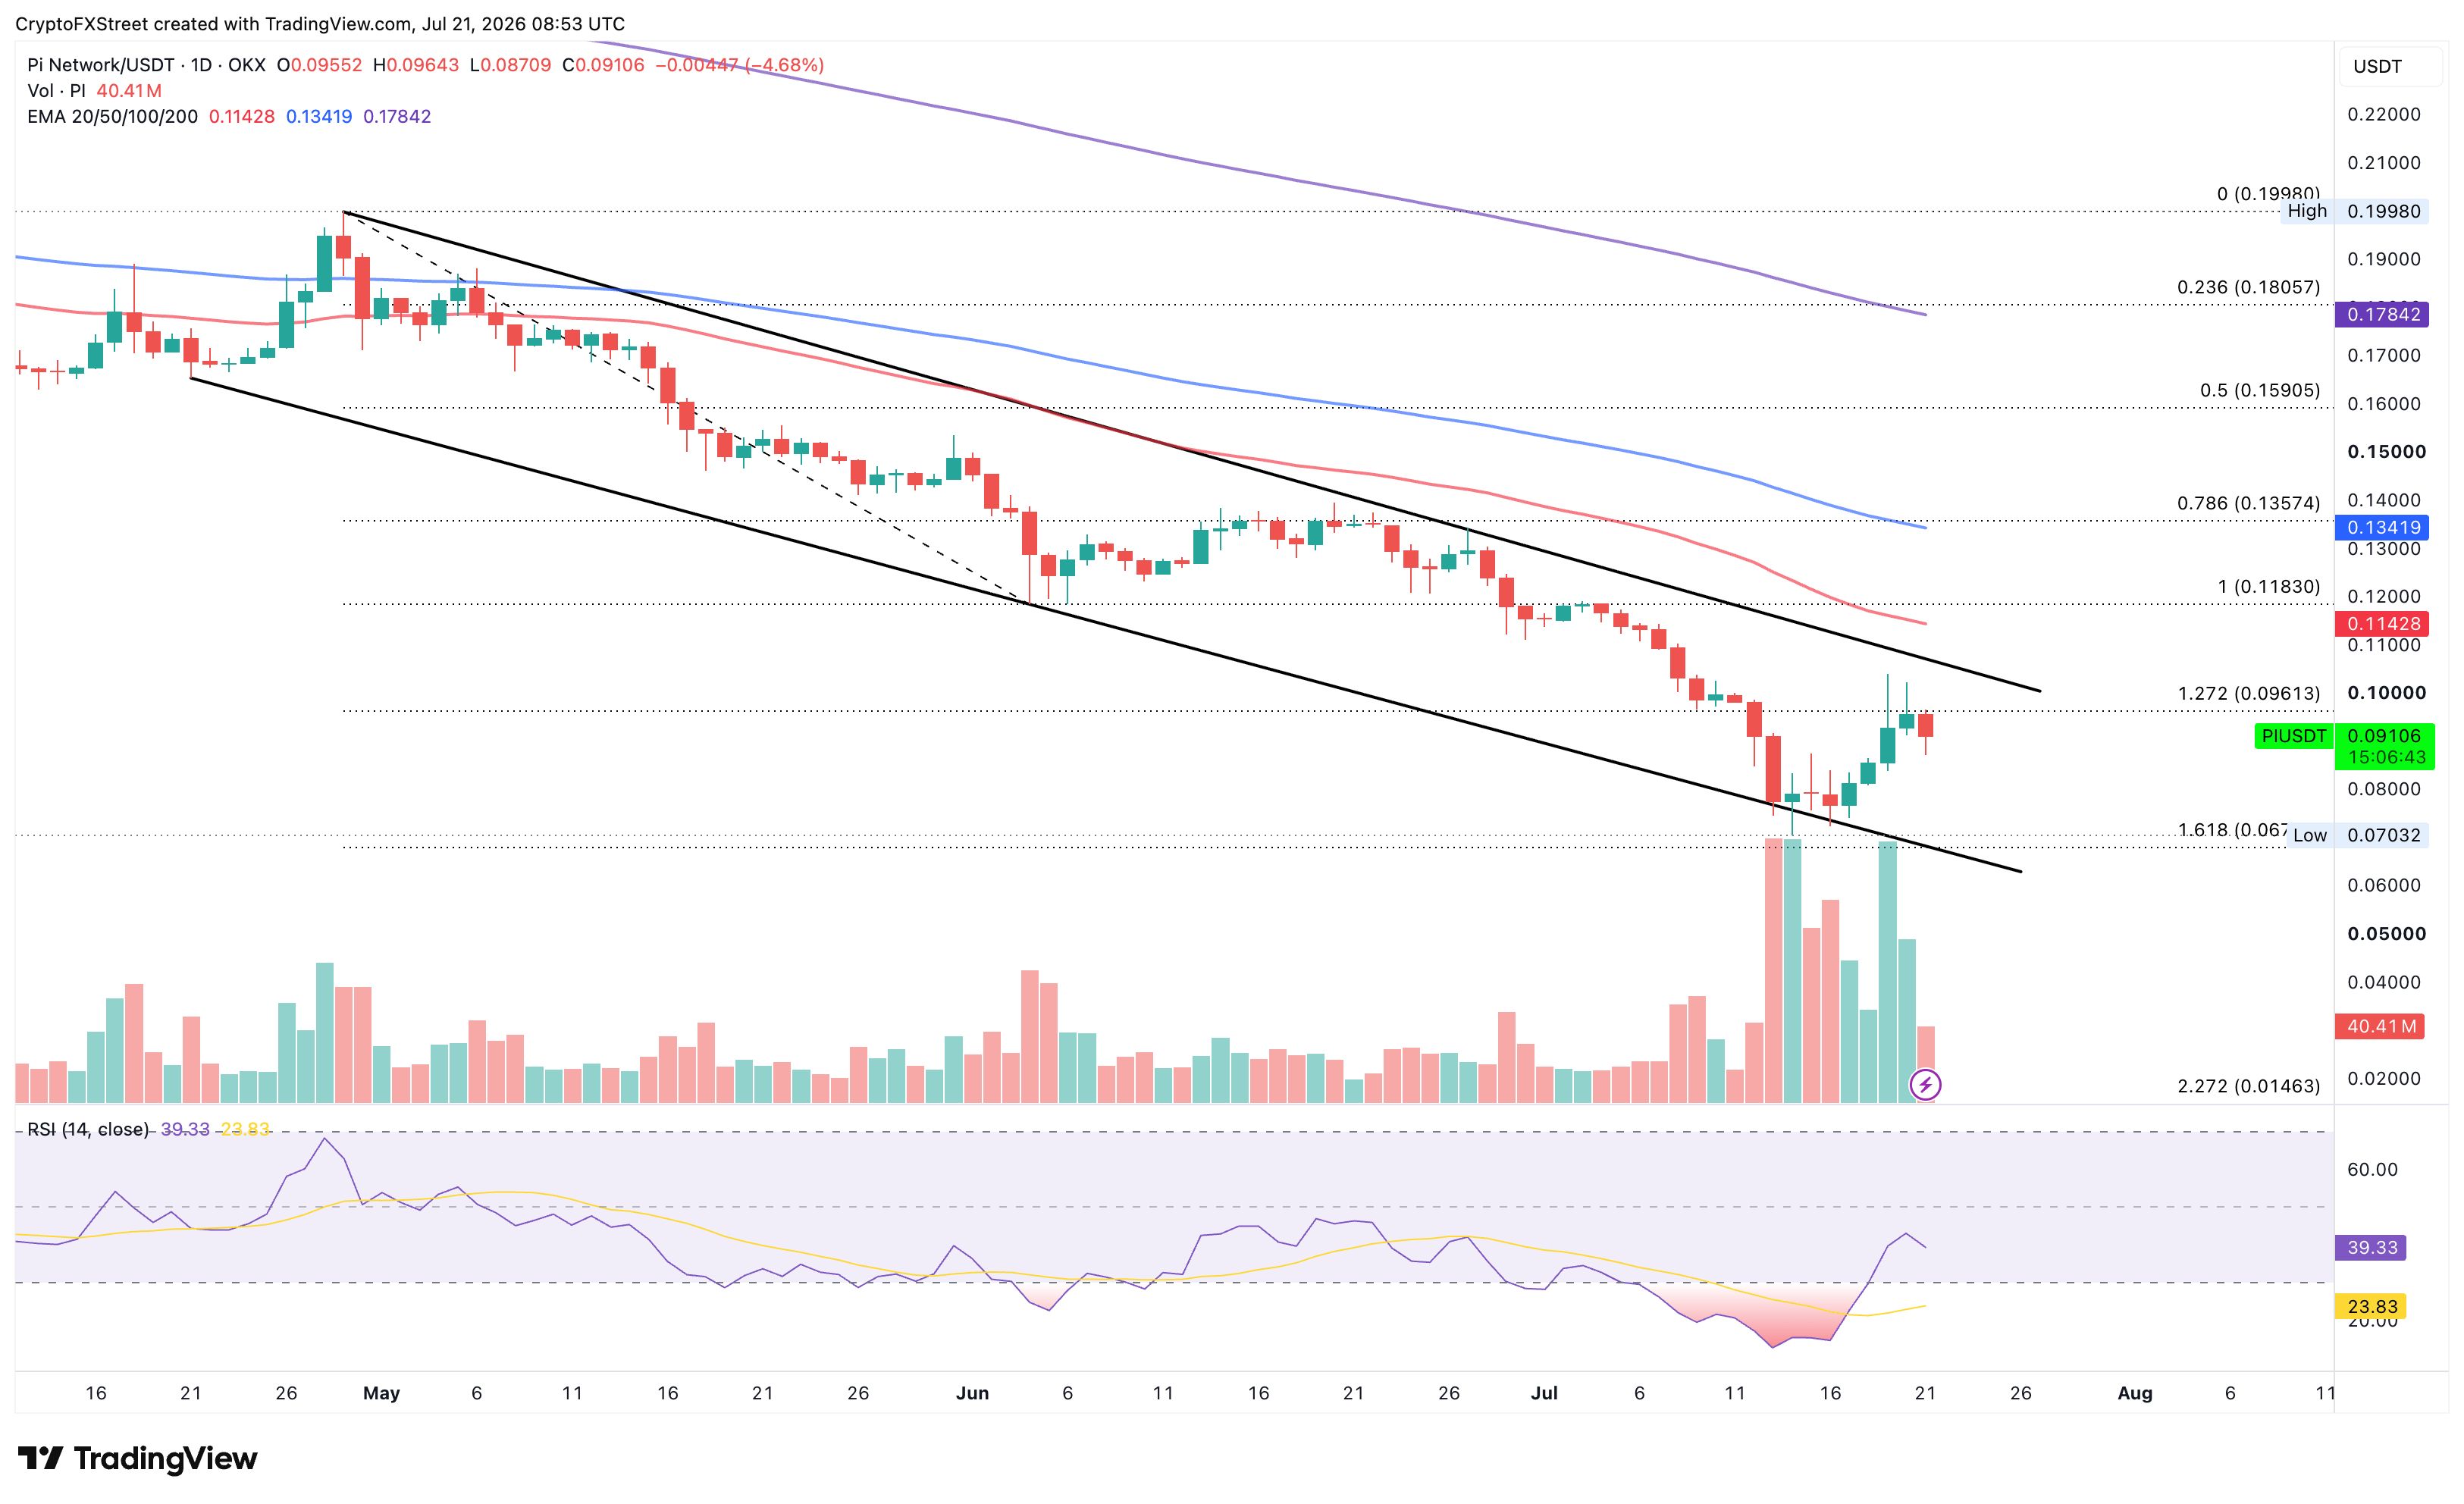
On the topside, PI should clear the overhead trendline near $0.10500 to reinstate a recovery trend. However, the prevailing bearish bias places the declining 50-day Exponential Moving Average (EMA) at $0.11428 as immediate resistance for a potential breakout rally.
(The technical analysis of this story was written with the help of an AI tool. Know more.)














