

NZD/USD Price Forecast: Tests 0.5800 as bullish momentum fades
- NZD/USD tests 0.5800 as 50-day SMA caps recovery.
- RSI turns bullish but fading slope warns of downside risk.
- Break below 0.5762 exposes 0.5743 and 0.5700 supports.
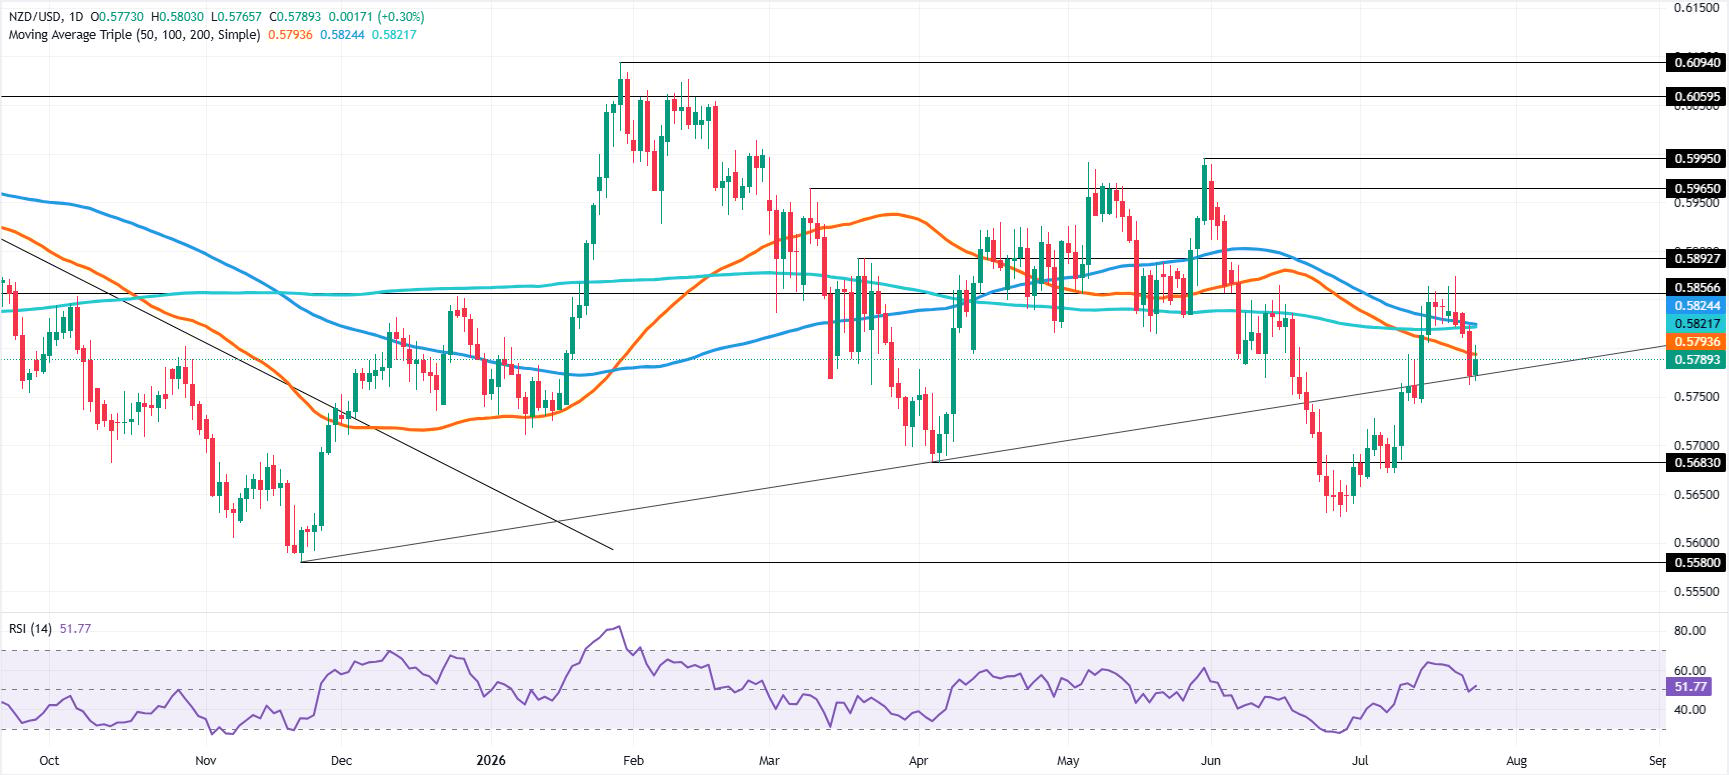
The New Zealand Dollar gains over 0.30% against the US Dollar, poised to test key resistance levels, with the 50-day Simple Moving Average (SMA) at 0.5793, slightly below the 0.5800 figure. At the time of writing, the NZD/USD trades at 0.5789, after bouncing off daily lows of 0.5767.
NZD/USD Price Forecast: Technical outlook
The Kiwi Dollar seems to recover during the day, but the overall trend is downwards, until the pair reclaims the May 29 high of 0.5995. Momentum turned bullish as depicted in the Relative Strength Index (RSI), but seems to be fading as the index is about to pierce bearish territory.

As of writing, the NZD/USD is testing key resistance below 0.5800. A breach of the latter will expose the confluence of the 100- and 200-day Simple Moving Averages (SMAs) at 0.5823/24, followed by the July 21 high at 0.5874. Above this area, the next resistance is the 0.5900, followed by the May 29 high, beneath 0.6000.
On the other hand, if NZD/USD breaches the low of the week (LOW) of 0.5762, it opens the door for further downside. The next key support is the July 13 low of 0.5743, followed by 0.5700. Beneath lies the July 7 high at 0.5672.
NZD/USD Price Chart – Daily
New Zealand Dollar Price This week
The table below shows the percentage change of New Zealand Dollar (NZD) against listed major currencies this week. New Zealand Dollar was the strongest against the Swiss Franc.
| USD | EUR | GBP | JPY | CAD | AUD | NZD | CHF | |
|---|---|---|---|---|---|---|---|---|
| USD | 0.51% | 0.95% | 0.92% | 0.58% | -0.22% | 0.77% | 1.20% | |
| EUR | -0.51% | 0.45% | 0.35% | 0.07% | -0.73% | 0.26% | 0.69% | |
| GBP | -0.95% | -0.45% | -0.09% | -0.38% | -1.17% | -0.19% | 0.28% | |
| JPY | -0.92% | -0.35% | 0.09% | -0.25% | -1.09% | -0.20% | 0.38% | |
| CAD | -0.58% | -0.07% | 0.38% | 0.25% | -0.76% | 0.05% | 0.67% | |
| AUD | 0.22% | 0.73% | 1.17% | 1.09% | 0.76% | 0.99% | 1.46% | |
| NZD | -0.77% | -0.26% | 0.19% | 0.20% | -0.05% | -0.99% | 0.47% | |
| CHF | -1.20% | -0.69% | -0.28% | -0.38% | -0.67% | -1.46% | -0.47% |
The heat map shows percentage changes of major currencies against each other. The base currency is picked from the left column, while the quote currency is picked from the top row. For example, if you pick the New Zealand Dollar from the left column and move along the horizontal line to the US Dollar, the percentage change displayed in the box will represent NZD (base)/USD (quote).














