

NEAR Protocol Price Forecast: NEAR risks a 15% drop as retail demand wanes
- NEAR Protocol extends losses on Wednesday, recording more than 10% over the last three days.
- Derivatives data point to declining retail support, with falling Open Interest and funding rates.
- The technical outlook for NEAR is bearish, with increasing downside momentum.
NEAR Protocol (NEAR) is trading in the red for the third consecutive day on Wednesday, bringing losses to more than 10% so far this week. Retail support for NEAR wanes, with its futures Open Interest (OI) and funding rate decreasing. The technical outlook for NEAR indicates roughly 15% downside potential, with bearish momentum remaining firm.

NEAR Protocol loses speculative demand amid broader market risk-off sentiment
NEAR Protocol is losing its retail strength in the derivatives market as broader crypto market sentiment turns risk-off. Crypto Fear and Greed Index at 35 shows a firm bearish grip on the market amid fears of a US Federal Reserve rate hike on Wednesday, as previously reported by FXStreet.
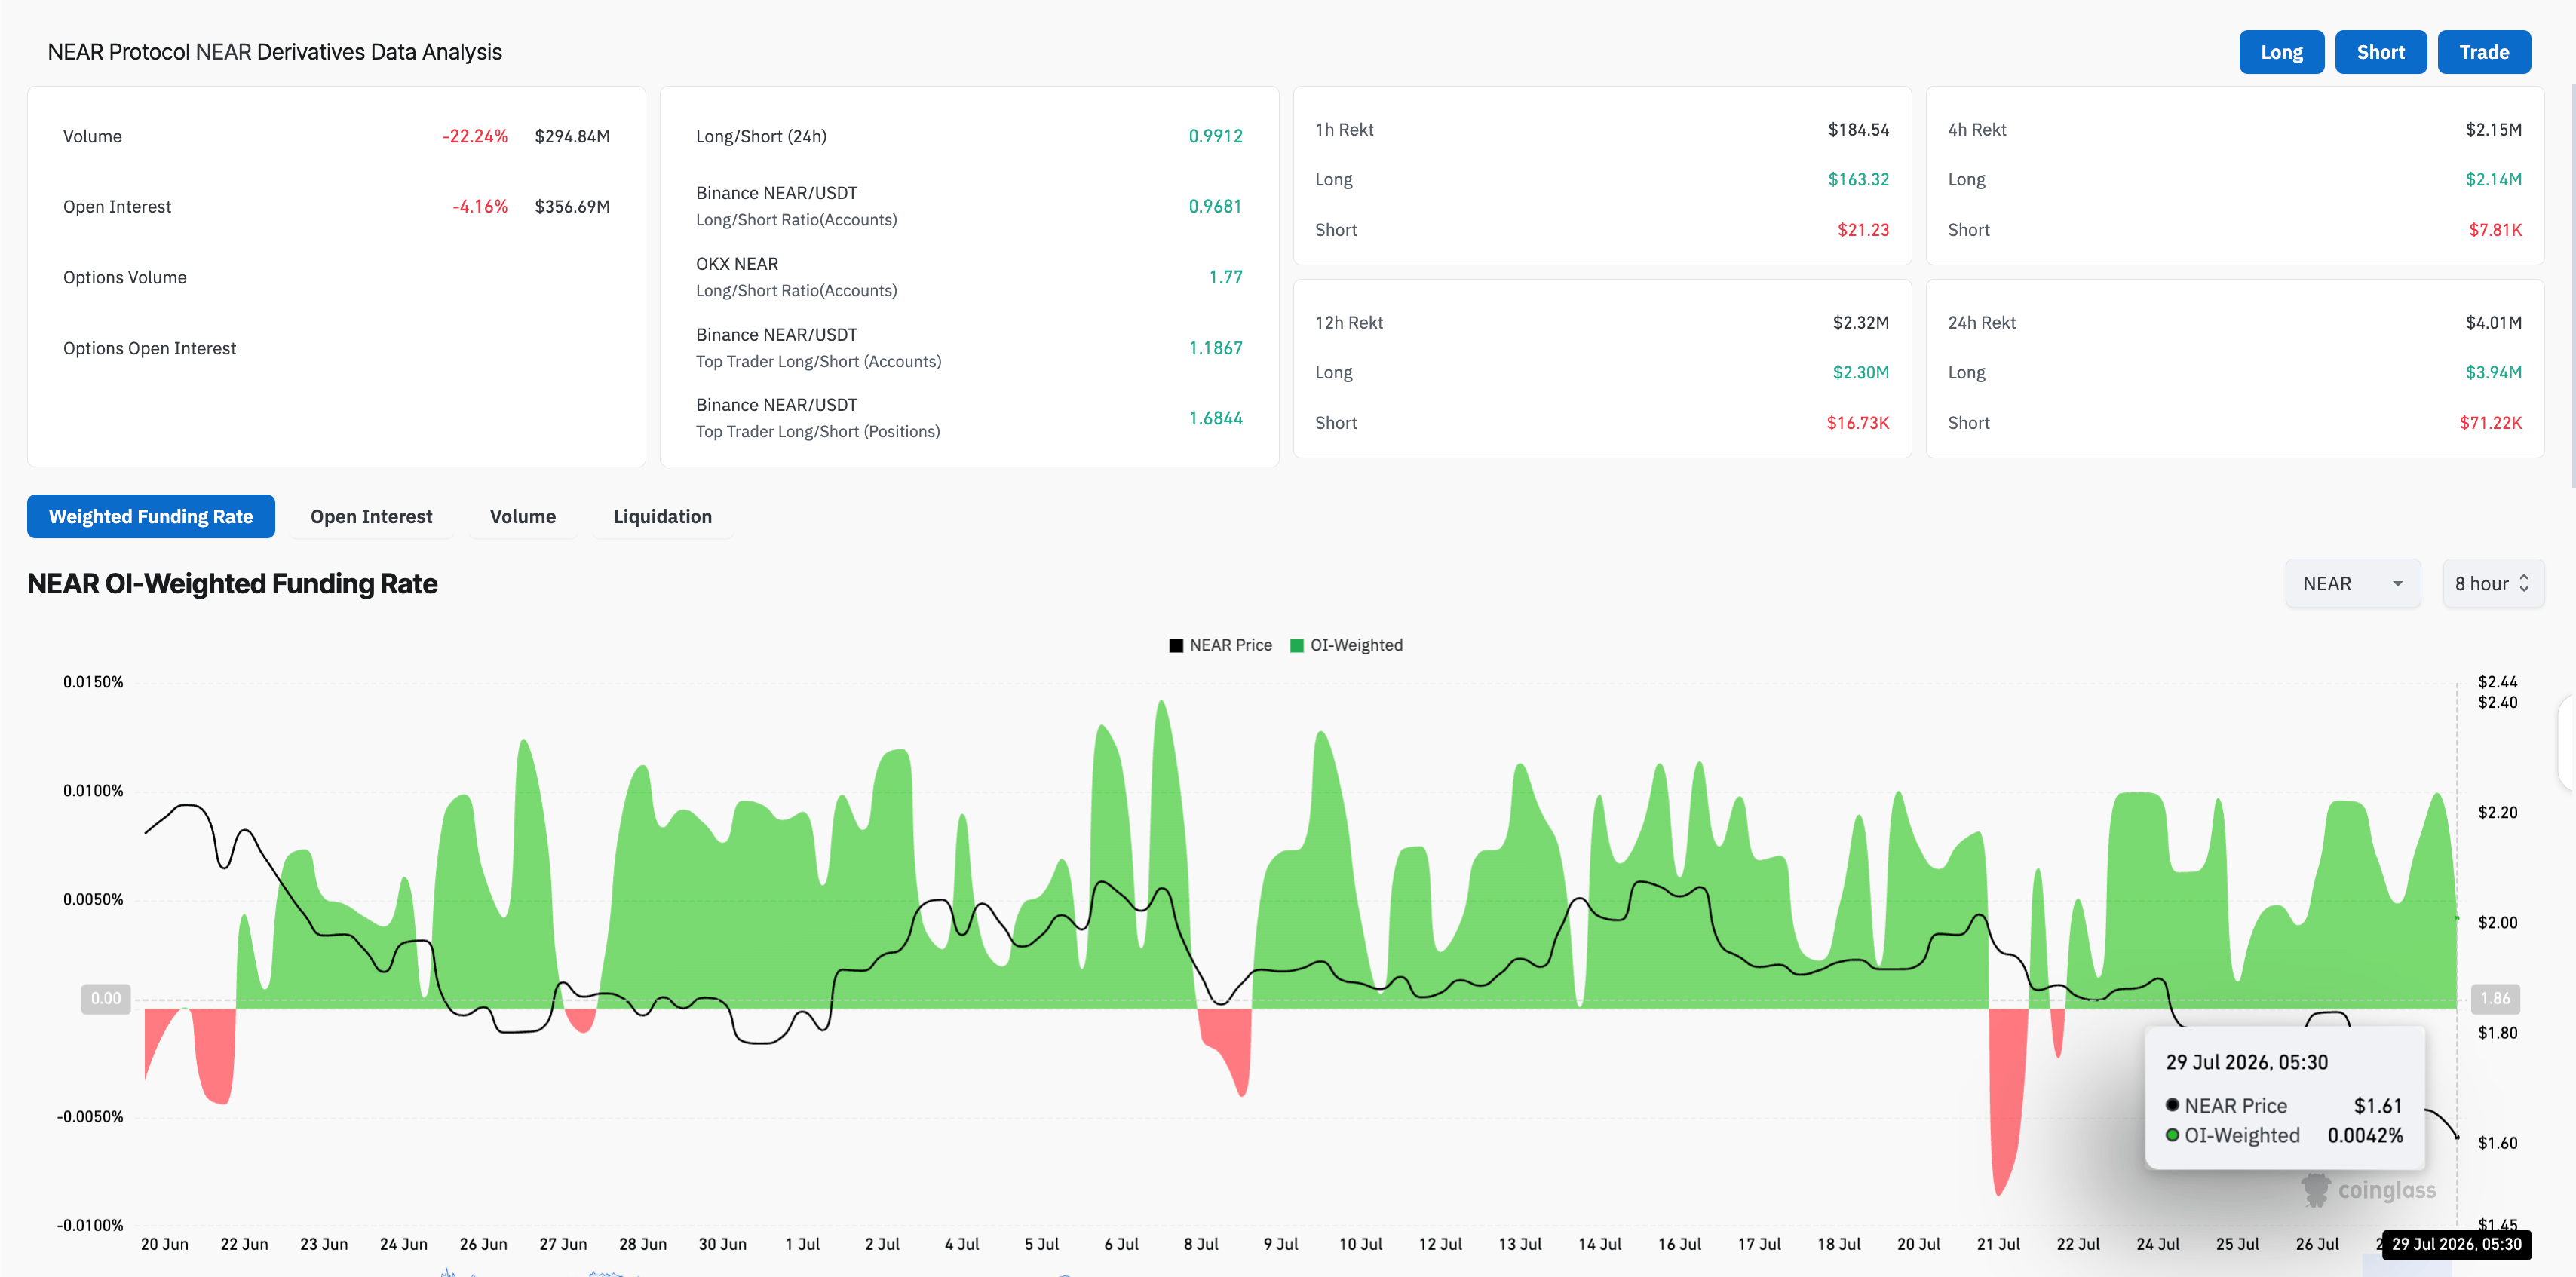
On the retail side, CoinGlass data show that NEAR futures Open Interest (OI) is down 4% over the past 24 hours to $356.69 million, reflecting a decline in the notional value of active contracts and a potential positional wipeout. Total liquidation of $4.01 million in the same period, led by $3.94 million in long liquidation, reaffirms a sell-side bias, wiping out long positions.
In addition, the funding rate has dropped to 0.0042% from 0.0099% the previous day, suggesting that bullish sentiment is easing among traders, reducing the premium paid to hold long positions.
Technical outlook: How low will NEAR price go?
NEAR Protocol maintains a bearish near-term bias, as price remains in a clear downward trend over the last two weeks. NEAR trades below both the 50-day and 200-day Exponential Moving Averages (EMAs) at $1.9050 and $1.8024, suggesting rallies remain capped for now.
The Relative Strength Index (RSI) near 31 signals weak momentum and proximity to oversold territory. The Moving Average Convergence Divergence (MACD) histogram is negative, with the MACD line below the signal line, reinforcing a downside tilt.
Looking down, the 23.6% Fibonacci retracement, measured from $3.1850 to $0.8140, at $1.3941 forms the first notable support, with the swing low zone near the 0.0% retracement at 0.8410 acting as a more distant structural floor if selling accelerates.
On the topside, initial resistance appears at the 38.2% Fibonacci retracement of the latest swing, sitting around $1.7364, ahead of the 200-day EMA at $1.8024 and the 50-day EMA at 1.9050. A daily close above these clustered EMAs would be needed to ease the prevailing bearish pressure and open the way toward the 50.0% retracement at $2.0130.
(The technical analysis of this story was written with the help of an AI tool. Know more.)













