

Lido DAO Price Forecast: LDO rally gains traction as bulls target 200-day EMA breakout
- Lido DAO is up over 4% on Tuesday, testing the 200-day EMA at $0.4002 after an 8% surge the previous day.
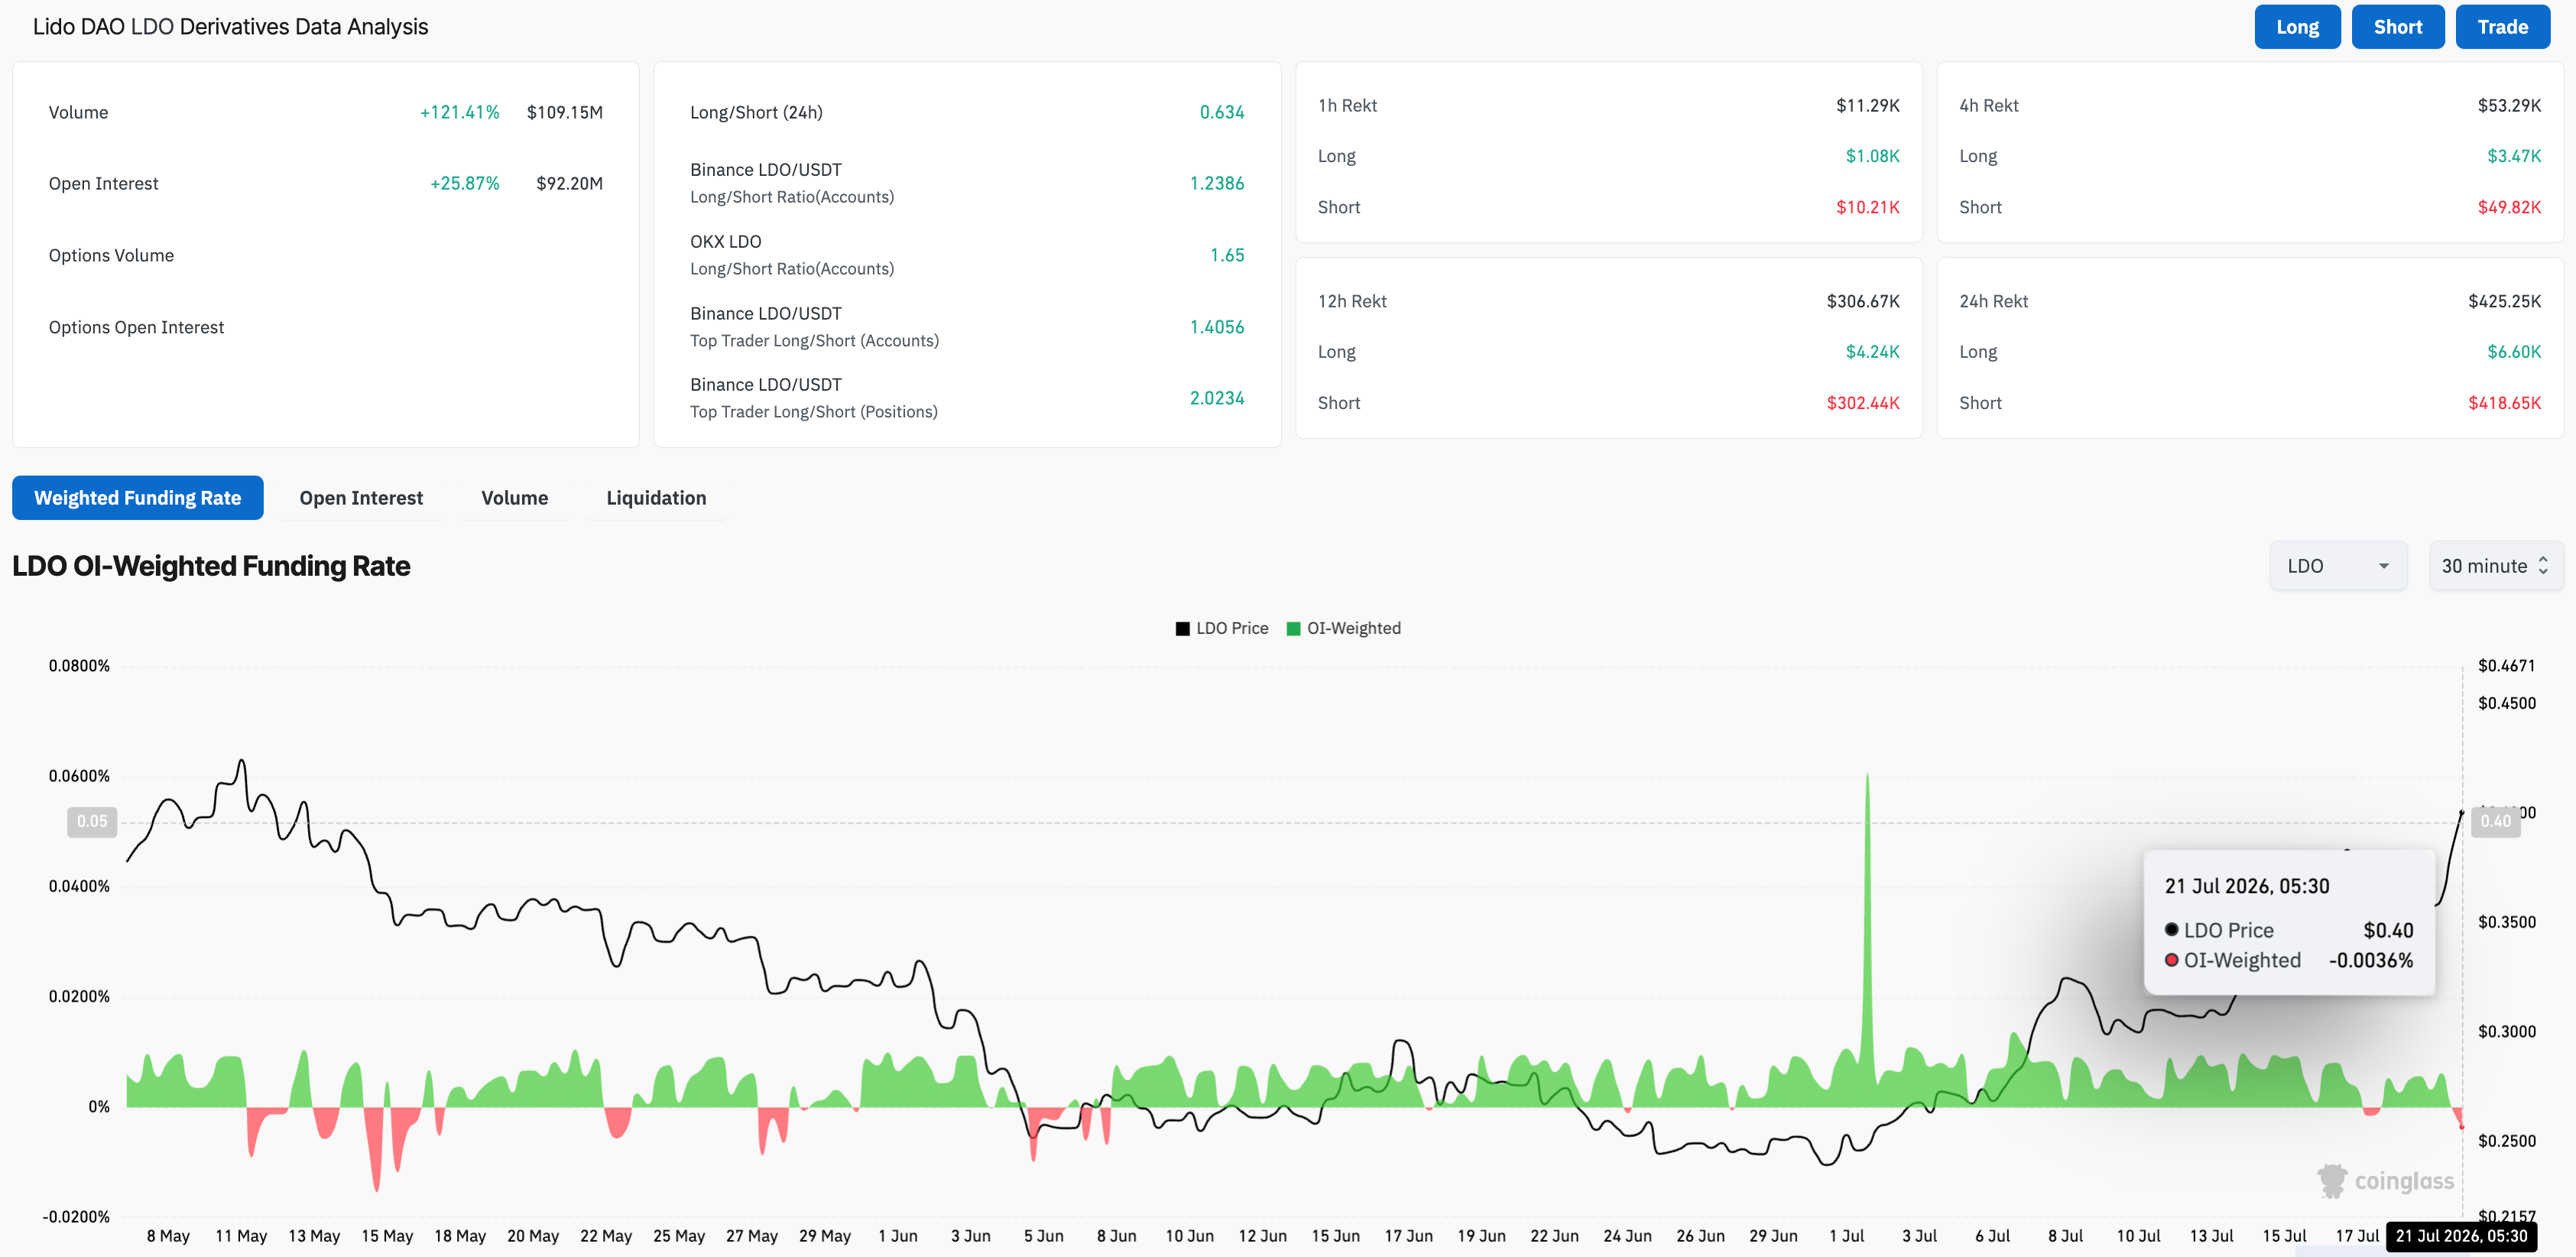
- Retail interest builds, with trading volume up over 100% in 24 hours, but the negative funding rate implies easing bullish conviction.
- The technical outlook for LDO is bullish, pointing to over 20% upside if price clears the 200-day EMA at $0.4002.
Lido DAO (LDO) edges higher by over 4% on Tuesday, extending its recovery for the fourth consecutive week with around 65% so far in July. LDO futures trading volume is up over 100% in 24 hours, suggesting a rise in retail interest, but the negative funding rate implies a waning of bullish conviction. Technically, Lido DAO must clear the 200-day Exponential Moving Average (EMA) around $0.4002.

Retail interest remains elevated
Lido DAO maintains firm retail interest following the launch of Nansen’s first staking product built on Lido V3 stVaults. CoinGlass data show LDO futures trading volume is up over 100% in the last 24 hours, reaching $109.15 million, reflecting increased speculative activity. At the same time, the Open Interest (OI) has increased roughly 26% to $92.20 million, reflecting an elevated notional value of active perpetual contracts.
However, the funding rate has dipped below zero to -0.0036%, from 0.0062% the previous day, indicating that sellers are paying a premium to buyers to hold short positions.
Technical outlook: Will Lido DAO extend gains?
Lido DAO hovers around $0.4000 at press time on Tuesday, extending 8% gains from the previous day. LDO has decisively pushed above the reclaimed resistance trendline, with the break price at $0.3543 now acting as a structural floor.
From a technical perspective, LDO tests the 200-day EMA around $0.4005, keeping the broader bias bullish. A decisive close above this moving average could target the $0.4913 horizontal resistance level, close to the $0.5000 psychological threshold.
The Moving Average Convergence Divergence (MACD) continues to rise with its signal line, hinting at persistent upside pressure. However, the Relative Strength Index (RSI) around 75 signals overbought conditions, warning of potential pullbacks ahead.
On the downside, initial support is seen at the former downward resistance trendline, now turned support, near $0.3543. A deeper pullback would expose the 50-day EMA at $0.3127 as a more significant medium-term floor.
(The technical analysis of this story was written with the help of an AI tool. Know more.)














