

EUR/JPY Price Forecast: Range holds as intervention fears bite
- EUR/JPY remains trapped below 187.00 after fresh two-day low.
- Flat RSI signals fading momentum despite broader bullish bias.
- Break below 185.35 exposes 185.12/08 SMA confluence.
The EUR/JPY holds firm around 163.70 on Monday as the Japanese Yen strengthens, with investors cautious about opening fresh hawkish bets amid fears of intervention in the foreign exchange market.
EUR/JPY Price Forecast: Technical outlook
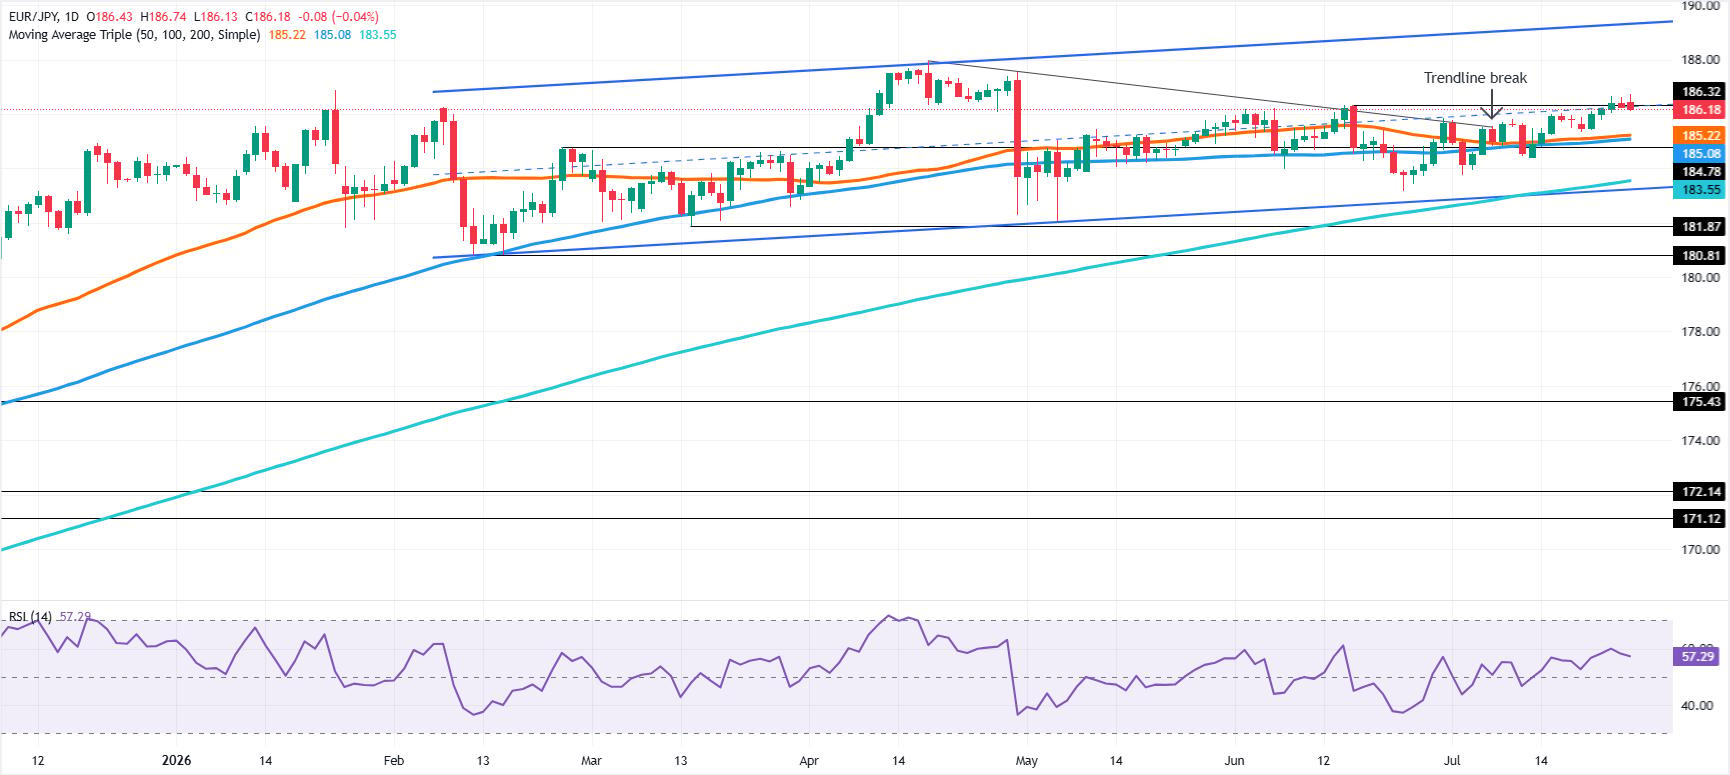
The EUR/JPY is range-bound, still capped within 186.00-187.00 over the last three trading days, but it has reached a new two-day low at 186.13, which could pave the way for further downside.

The Relative Strength Index (RSI), although bullish, turned flat, an indication that neither buyers nor sellers are in control.
If EUR/JPY climbs above 186.50, a potential move towards the 187.00 psychological level is on the cards. Further upside is seen once buyers reclaim the latter, with the July 1990 monthly high at 188.23 in play, before aiming towards 189.00.
On the downside, the EUR/JPY will find support at 185.35, the July 20 low of the day (LOD). A breach of the latter will expose the confluence of the 50- and 100- day Simple Moving Average (SMA) at 185.12/08, followed by the July 13 cycle low of 184.40.
EUR/JPY Price Chart – Daily
Japanese Yen Price Today
The table below shows the percentage change of Japanese Yen (JPY) against listed major currencies today. Japanese Yen was the strongest against the British Pound.
| USD | EUR | GBP | JPY | CAD | AUD | NZD | CHF | |
|---|---|---|---|---|---|---|---|---|
| USD | -0.04% | 0.22% | -0.08% | 0.19% | -0.18% | 0.16% | 0.08% | |
| EUR | 0.04% | 0.23% | -0.07% | 0.20% | -0.16% | 0.22% | 0.10% | |
| GBP | -0.22% | -0.23% | -0.30% | -0.02% | -0.38% | -0.05% | -0.12% | |
| JPY | 0.08% | 0.07% | 0.30% | 0.25% | -0.10% | 0.25% | 0.18% | |
| CAD | -0.19% | -0.20% | 0.02% | -0.25% | -0.35% | -0.01% | -0.09% | |
| AUD | 0.18% | 0.16% | 0.38% | 0.10% | 0.35% | 0.36% | 0.25% | |
| NZD | -0.16% | -0.22% | 0.05% | -0.25% | 0.01% | -0.36% | -0.12% | |
| CHF | -0.08% | -0.10% | 0.12% | -0.18% | 0.09% | -0.25% | 0.12% |
The heat map shows percentage changes of major currencies against each other. The base currency is picked from the left column, while the quote currency is picked from the top row. For example, if you pick the Japanese Yen from the left column and move along the horizontal line to the US Dollar, the percentage change displayed in the box will represent JPY (base)/USD (quote).














