

Ethereum Price Forecast: Can Fed decision unsettle the calmness in ETH?
Ethereum price today: $1,910
- ETH derivatives showed traders trimming positions and moving toward neutral grounds before the Fed's decision to leave rates unchanged.
- The spot market also aligns with selling activity decreasing and inflows into ETH ETFs dropping to their lowest levels in July.
- ETH continues to seek direction within the tight short and long-term EMAs range.
Ethereum (ETH) climbed above $1,900 on Wednesday following the Federal Open Market Committee's (FOMC) decision to leave interest rates unchanged at 3.50-3.75%. The decision follows a quiet derivatives and spot market for the top altcoin, with traders waiting for the decision before making a move, according to CryptoQuant analysts.

In a report on Wednesday, the analysts highlighted that long traders in ETH perpetual futures have been booking profits near $1,880, but short dominance remains weakened, indicating that traders are scaling down exposure rather than betting on a fresh price decline.
ETH's Taker Buy Sell Ratio is also around neutral levels, with its 168-hour moving average dropping to 1.00. A similar trend is evident in Bitcoin, where the metric has slipped from 1.04 last week toward 1.00, meaning the volume of long and short traders executing trades against market orders is roughly balanced.
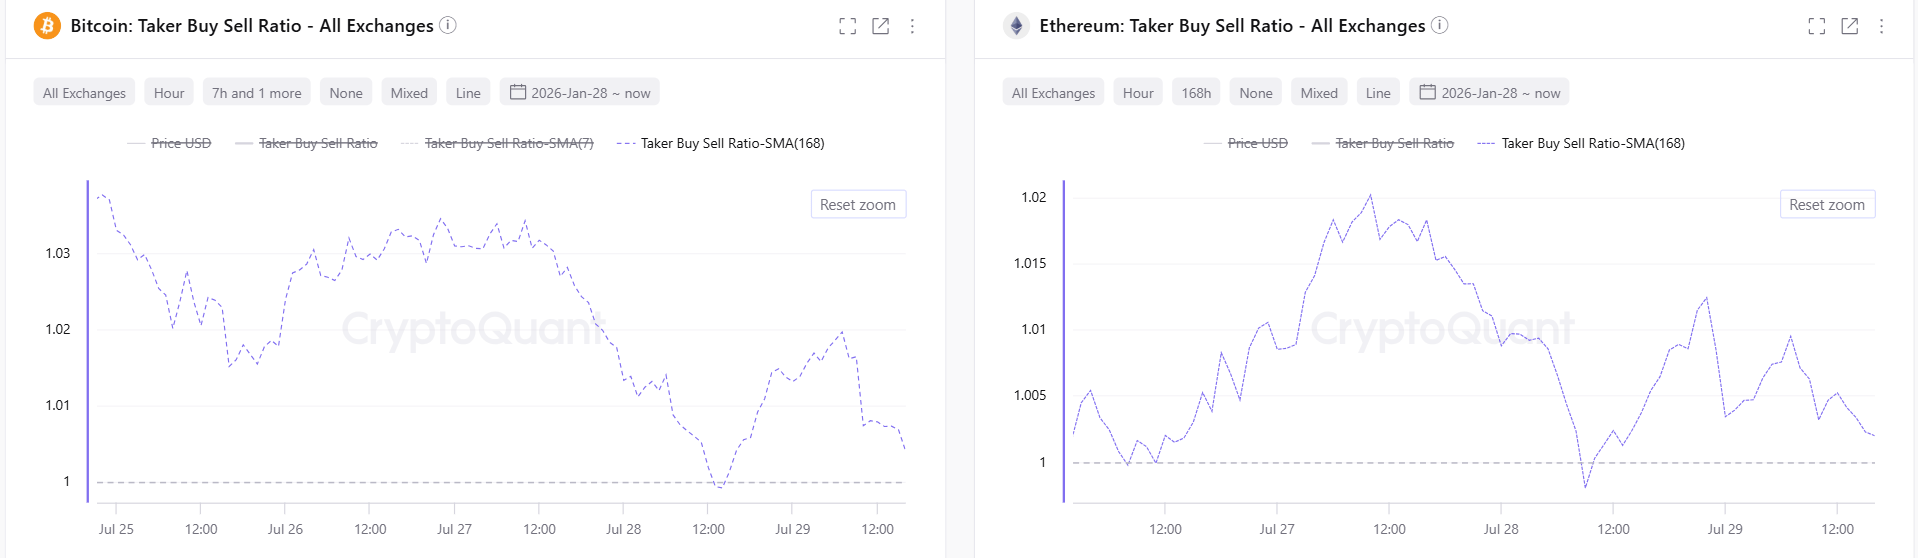
"A neutral book into the event means the FOMC outcome could tip dominance either way and drive a sharp rise in volatility," CryptoQuant noted.
Similarly, the Net Taker Volume, which measures similar metrics but in ETH perpetual markets, eased from 28.9 million to 733K on Tuesday.
In addition, the analysts shared that ETH funding rates on the Deribit exchange have remained positive around 0.0011%, indicating a modestly long-biased market. A sustained positive funding environment could put crowded long positions at risk as a shift toward negative funding could amplify volatility and spur a long squeeze.
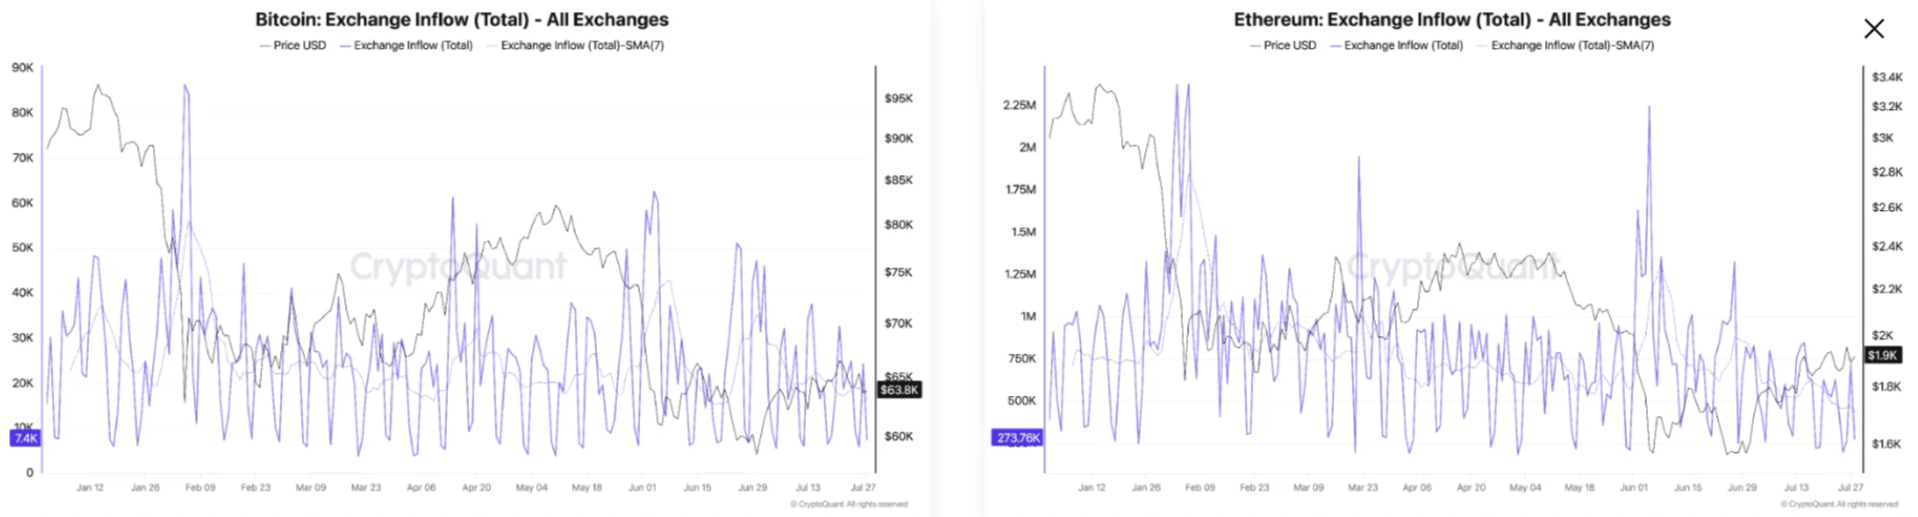
On the spot side, exchange inflows have slowed considerably for the top altcoin alongside Bitcoin. The report noted that inflows for both coins are around 274K ETH and 7.4K BTC, showing weak selling pressure.
"Both [are] toward the lower end of their 2026 ranges and well below the 50K+ BTC and 2M+ ETH spikes seen earlier in the year. Subdued inflows suggest holders are not rushing to sell into the meeting, consistent with traders already discounting the expected no-change decision," CryptoQuant analysts wrote.
Institutional activity also indicates neutral sentiment as inflows into US spot ETH exchange-traded funds (ETFs) dropped to $9.2 million and $14.5 million over the past two days, their lowest net inflows so far in July, according to SoSoValue data.
Earlier reports hinted at a few ETH investors distributing near their on-chain cost basis to potentially de-risk ahead of the FOMC's decision.
With the FOMC leaving rates unchanged, the market has slightly tilted toward the upside as traders await the press conference of Fed Chair Kevin Warsh.
Ethereum technical analysis: ETH seeks direction in tight EMAs range
Ethereum has recorded $53 million in liquidations over the past 24 hours, led by $27.2 million in long liquidations, per Coinglass data.
On the daily chart, ETH is consolidating in a neutral-to-bullish stance as it holds above the 20-day and 50-day Exponential Moving Averages (EMAs) at roughly $1,868 and $1,846, respectively, while still capped by the 100-day EMA at about $1,935.
The 14-day Relative Strength Index (RSI) hovers around 57, suggesting moderate bullish momentum that could sustain the current bid as long as price remains above this nearby confluence of dynamic supports.
On the topside, immediate resistance is seen at the 100-day EMA around $1,935, followed by the horizontal barrier at $1,961, with higher hurdles then aligning at $2,172 and $2,432.
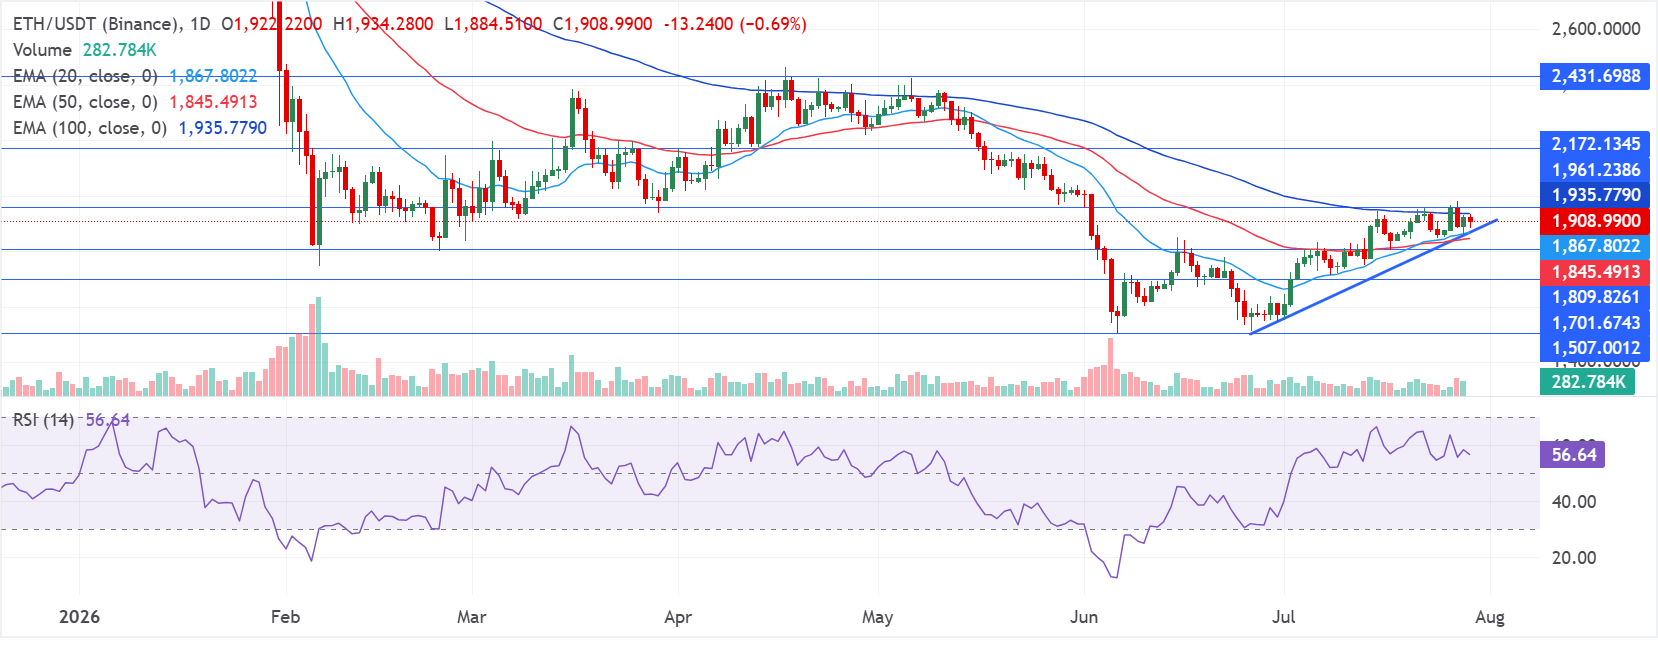
On the downside, initial support is located at the trendline region near $1,876 before the 20-day and 50-day EMAs. The next horizontal floor is at $1,810, with deeper cushions emerging near $1,702 and $1,507 if selling pressure accelerates.
(The technical analysis of this story was written with the help of an AI tool. Know more.)













