

Ethereum Price Forecast: ETH climbs 7% amid declining inflation, weak retail and whale participation
Ethereum price today: $1,880
- Ethereum recorded a 7% gain on Monday after US inflation declined in June.
- Whale and retail wallets are yet to experience major changes in their balance.
- ETH approaches the $1,909 resistance after bouncing off the 20-day EMA and $1,741 support level again.
Ethereum (ETH) jumped more than 7% above $1,850 on Tuesday following a weaker-than-expected US Consumer Price Index (CPI) report for June.
The inflation data fell to 3.5% below expectations of 3.8%, marking a month-on-month decline of 0.4%, its largest monthly drop since May 2020. Core CPI also fell to 2.6% below forecasts of 2.8%.

Following the decline, odds of the Federal Reserve (Fed) hiking rates at its next meeting on July 29 dropped to 8%. The move prompted a quick rally across risk assets, with the wider crypto market seeing a 2.4% gain alongside a broader stock market rally.
Notably, the price jump particularly shook traders betting on the downside in ETH futures market, with roughly $113 million in short liquidations over the past 24 hours.
The recent gains add to a mild recovery in the top altcoin over the past week after a slight improvement in overall sentiment across risk assets.
Despite the gains, retail and whale holdings have seen minimal changes. Wallets with a balance of 100-1K and 1K-10K ETH depleted their collective holdings by 30K ETH over the past week.
Similarly, whales or wallets with a balance of 10K-100K ETH reduced their holdings by 20K ETH. The decline in the balances of these cohorts indicates a continued cautious outlook across whale and retail investors.
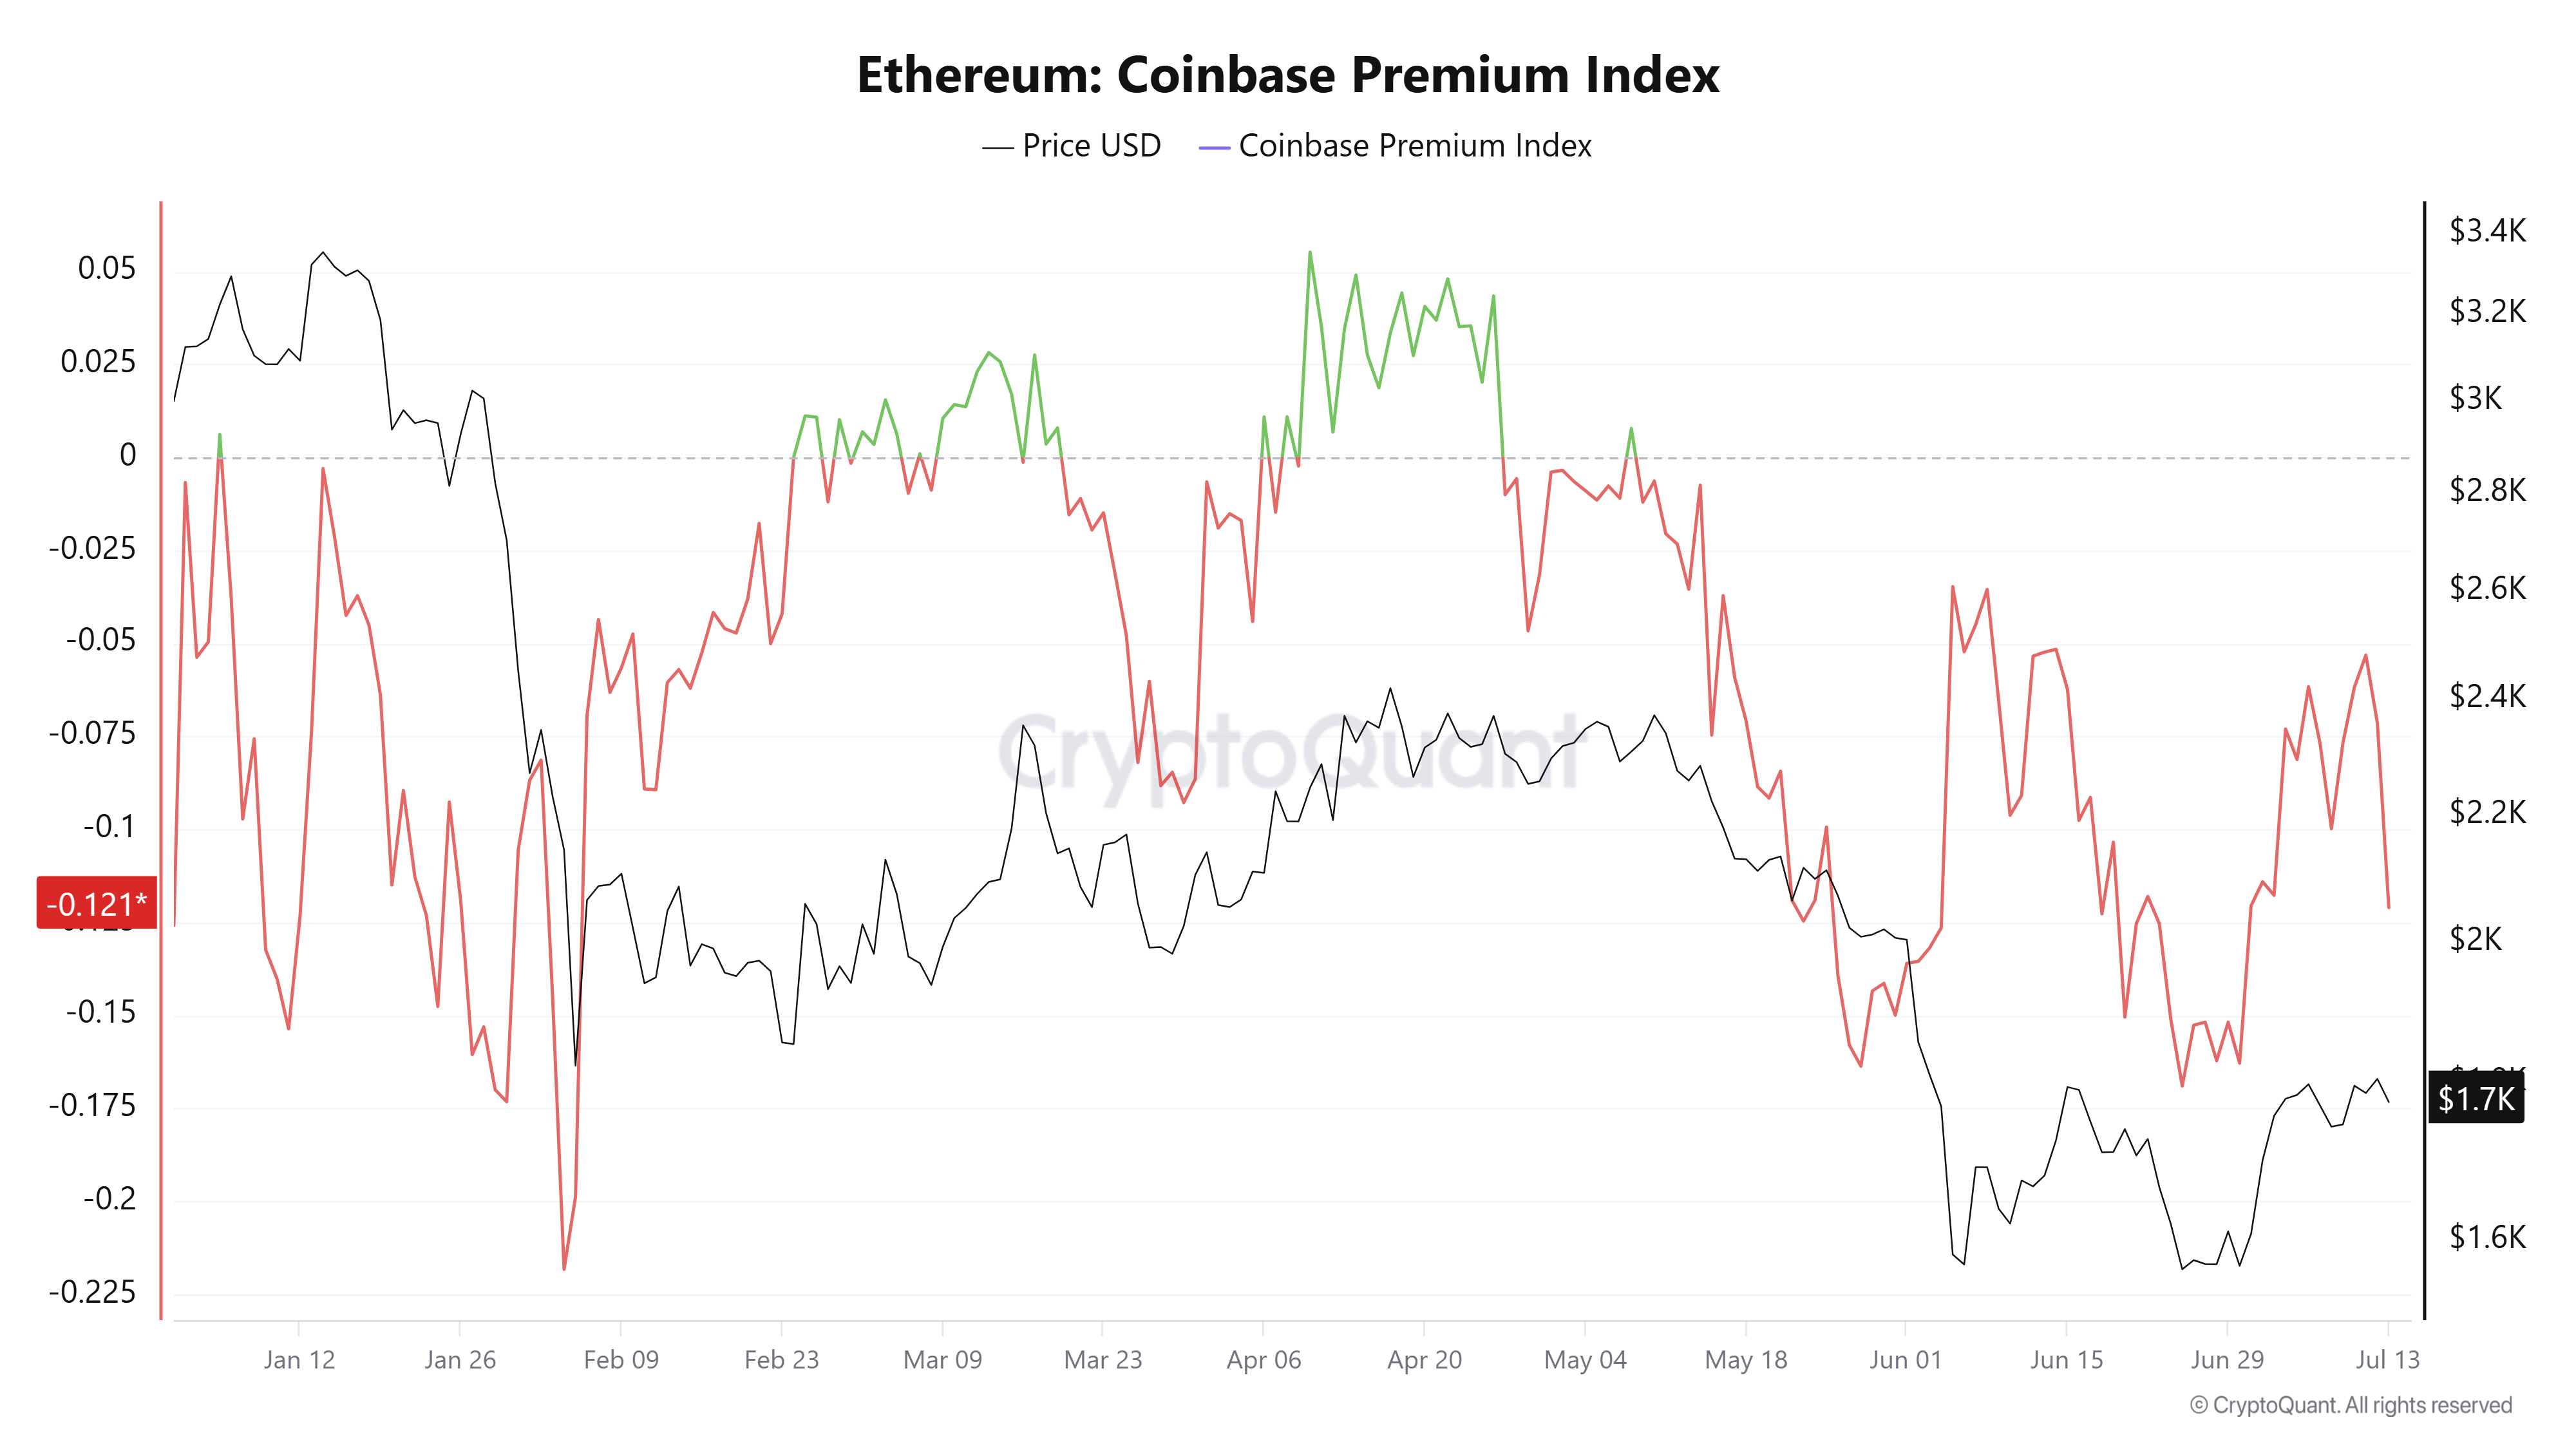
In addition, US momentum is fading again after a slight increase over the past week. The decline is evident in the Coinbase Premium Index, which dropped to -0.121 on Monday.
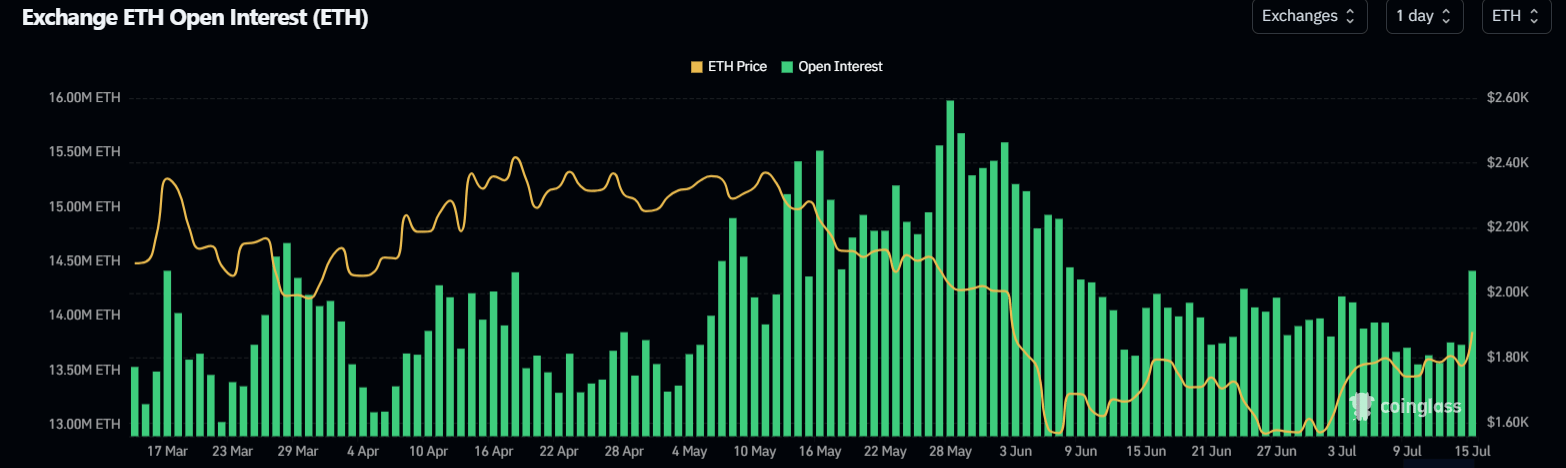
However, on the derivatives side, open interest, which represents the total worth of outstanding contracts in a derivatives market, jumped by roughly 680K ETH to 14.41 million ETH on Tuesday, its highest level in more than a month. The move indicates that the price rise is supported by the return of leveraged capital from bullish traders. Funding rates leaned positive, a pattern that has persisted since ETH began its recovery earlier in the month.
Ethereum Price Forecast: ETH eyes $1,909 resistance after bounce off 20-day EMA and $1,741
On the daily chart, ETH is maintaining a constructive near-term bias as price holds above the 20- and 50-day Exponential Moving Averages (EMAs) at $1,755 and $1,802, respectively and remains capped by the 100-day EMA at $1,948.
The Relative Strength Index (RSI) at 64 and a stretched Stochastic reading near 96 suggest firm bullish momentum, though the overbought signals hint that upside could slow as price approaches the nearby resistance band.
On the topside, initial resistance is seen at the horizontal barrier at $1,909, followed by $2,018 and $2,107, before a stronger cluster emerges around $2,211 and $2,388.
On the downside, immediate support is provided by $1,806 and the 50-day EMA at $1,802, with the 20-day EMA at $1,755 and the horizontal level at $1,741 underpinning the structure after providing another bounce. Deeper pullbacks would expose $1,524 and $1,404.
(The technical analysis of this story was written with the help of an AI tool. Know more.)














