

Curve DAO Price Forecast: CRV tests breakout rally as bulls target over 15% upside
- Curve DAO is up 4% on Tuesday, becoming one of the top performers in the past 24 hours.
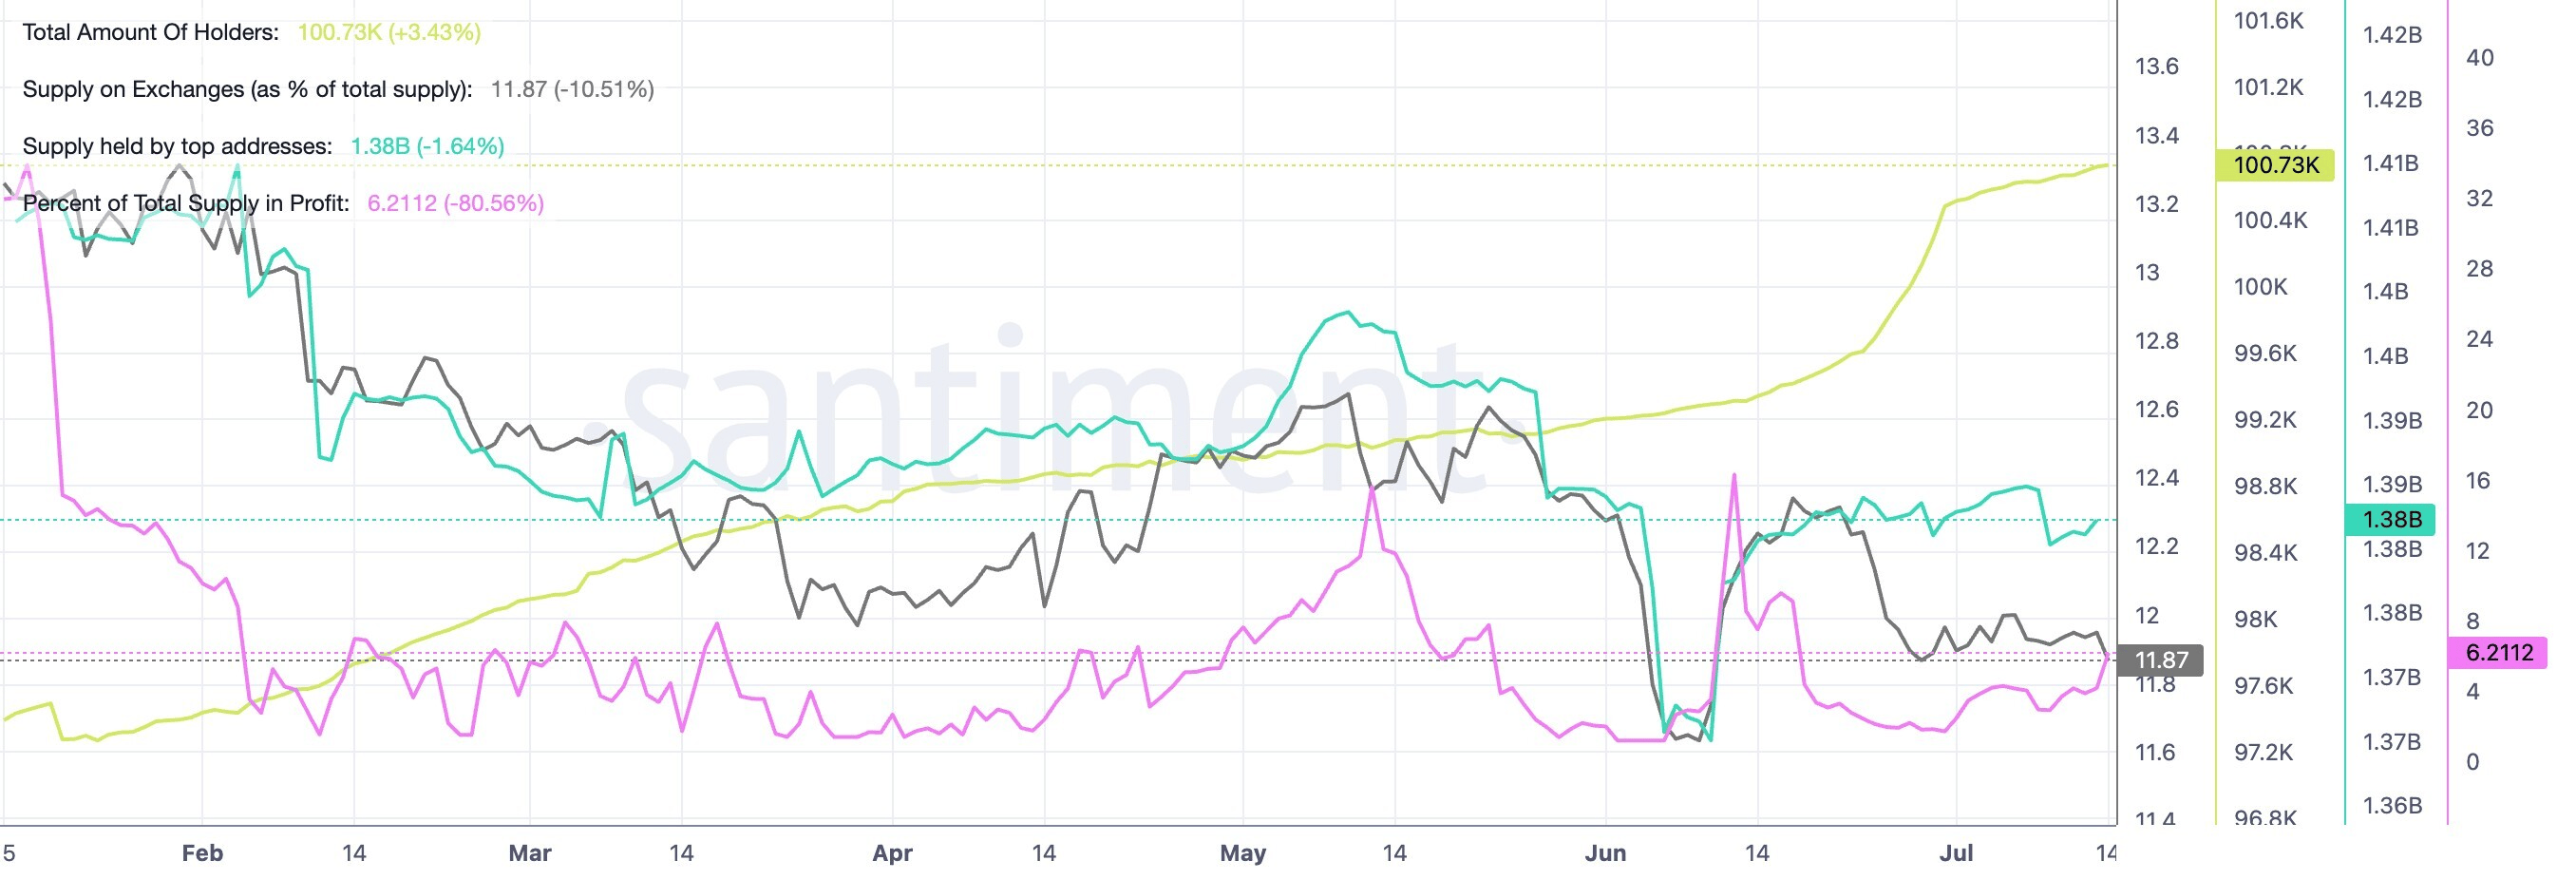
- On-chain data show signs of recovery, with exchange supply declining while top addresses' holdings and supply in profit rise.
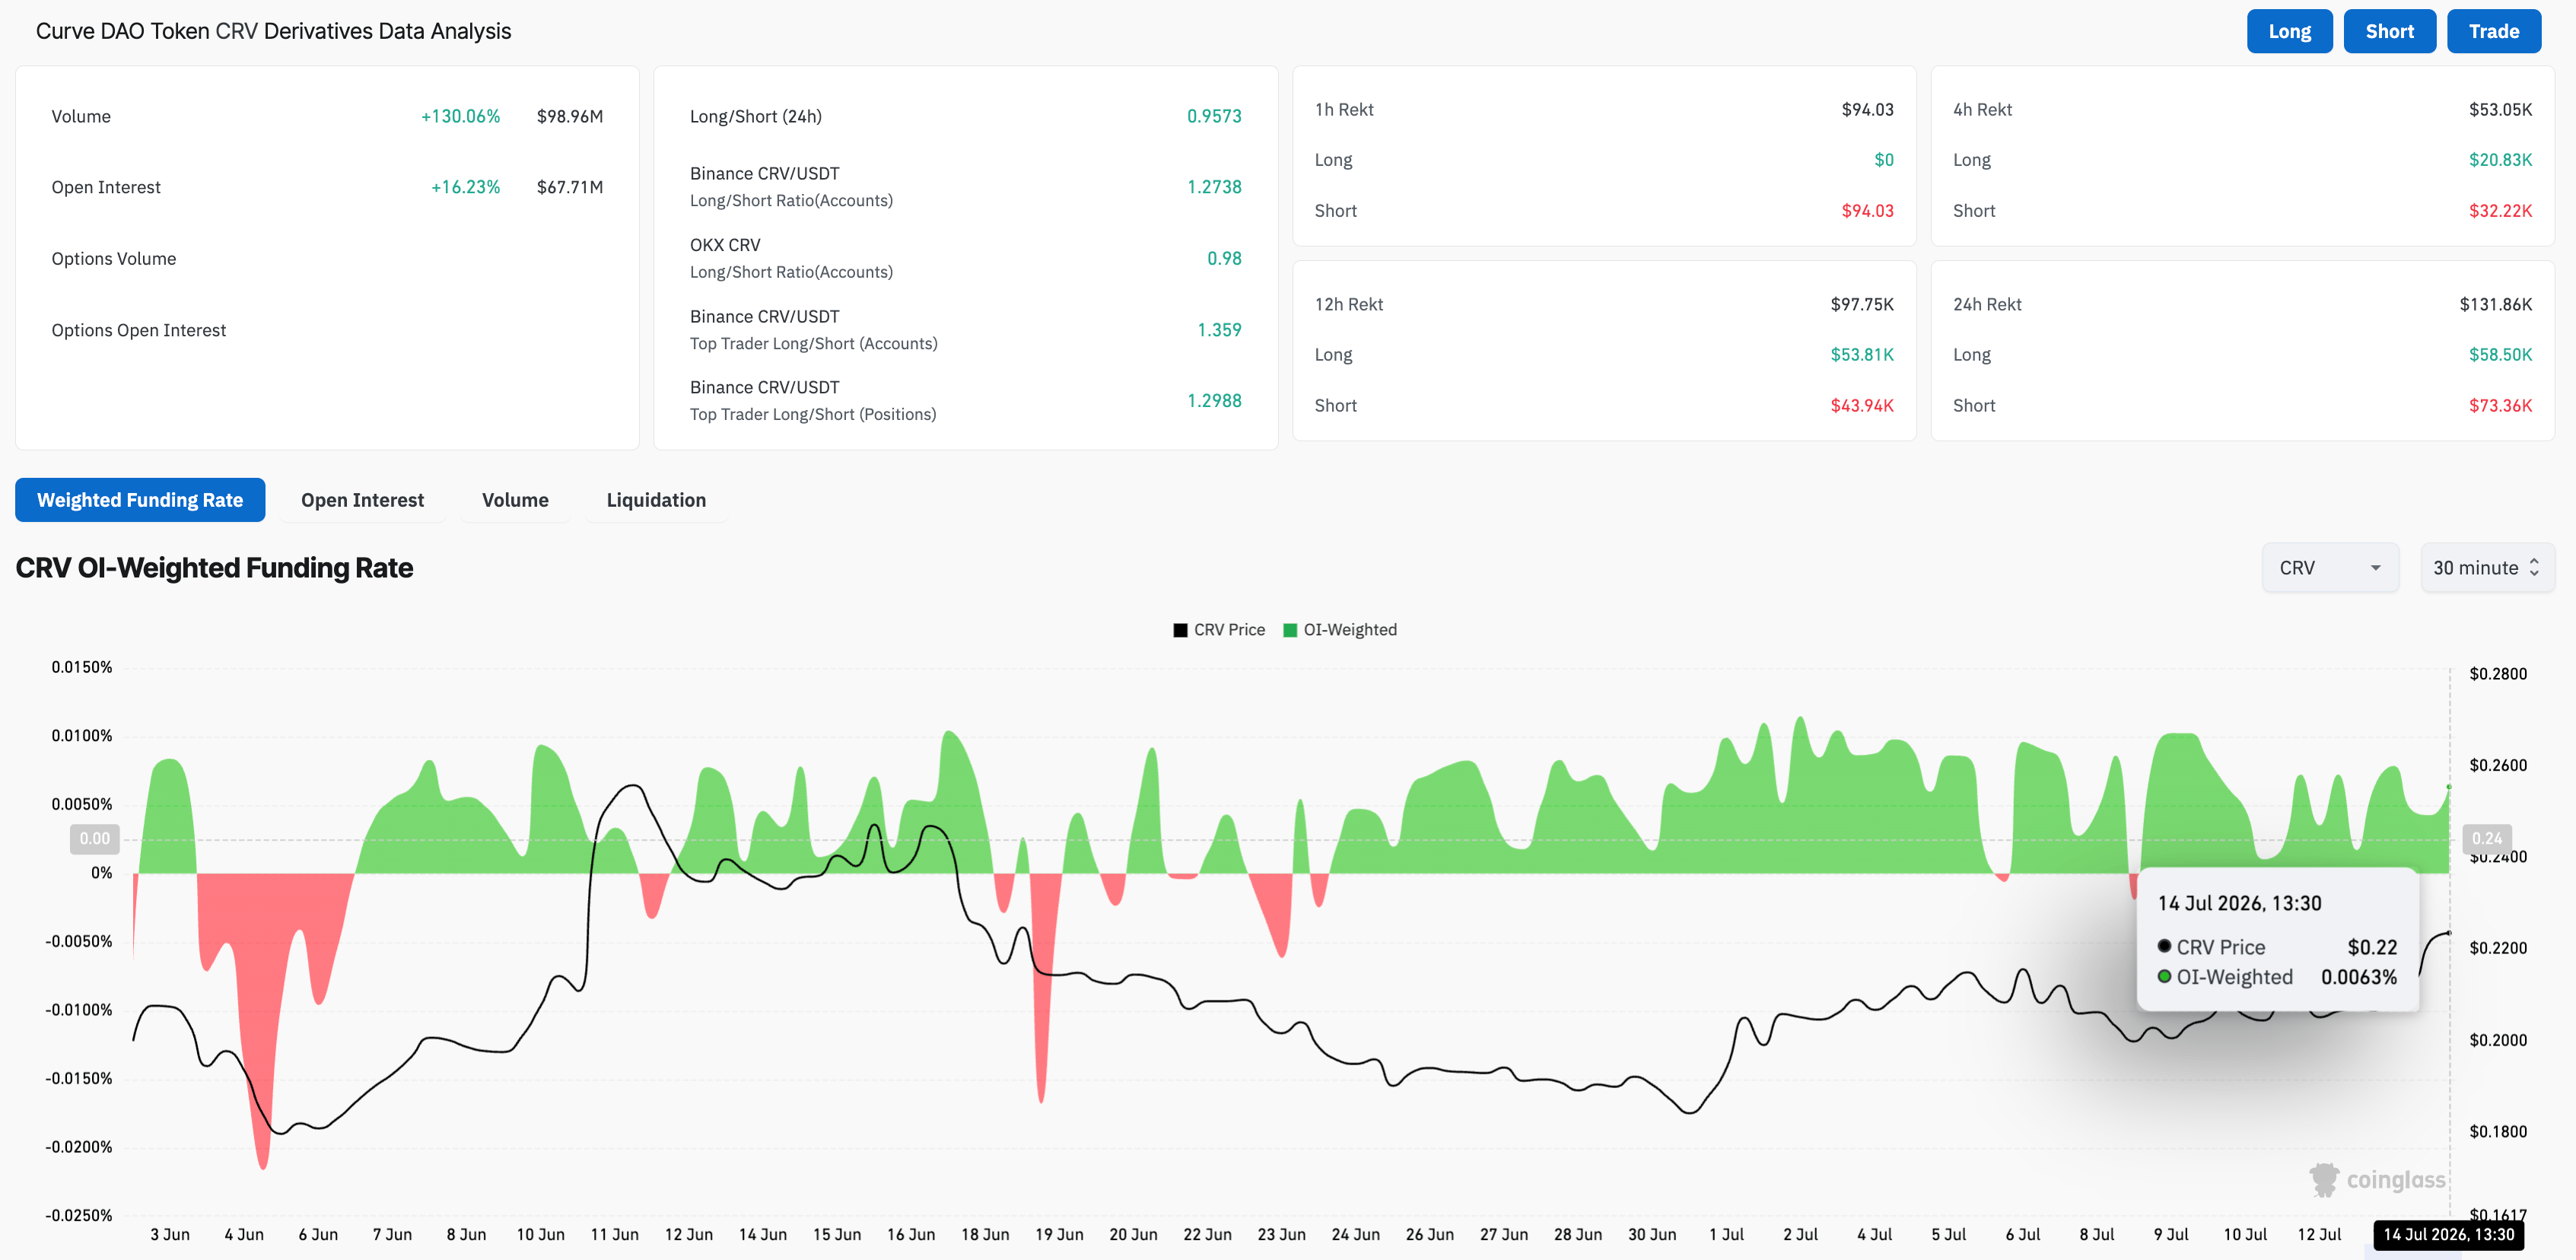
- Retail demand builds amid a mild recovery in CRV, driving Open Interest up 16% over 24 hours.
Curve DAO (CRV) price is up 4% on Tuesday, extending its 3% gains from the previous day to emerge as the best-performing altcoin over the last 24 hours. On-chain data shows waning selling pressure as supply available on exchanges declines, while top holders increase their exposure amid rising supply in profit. Retail demand shows a sharp rise in speculative demand for CRV, with Open Interest up 16% over the last 24 hours, indicating heightened leverage exposure.

Technically, CRV must clear above the key retracement level at $0.2232 to extend its rally toward $0.2608.
First signs of renewed demand for CRV
Curve DAO witnesses first signs of on-chain bullish signals. Santiment data shows CRV supply on exchanges is down to 11.87% of total supply, from the 12.34% spike on June 17. In addition, the top holders now control 1.38 billion CRV tokens, up from 1.37 billion on June 10, while the supply in profit has increased to 6.21%, up from 4.20% the previous day.
On the network side, the total number of holders has crossed 100,000, reflecting steady adoption.
In the near term, Curve DAO regains retail support. CoinGlass data show that CRV futures Open Interest (OI) is up 16% over the last 24 hours, suggesting a surge in positional buildup, which typically reflects speculative demand. The funding rate at 0.0063% has remained above zero so far this week, indicating a bullish bias in the positional buildup, as buyers are willing to take long positions.
Will CRV price extend gains for a 15% breakout rally?
Curve DAO token extends recovery above its 50-day Exponential Moving Average (EMA) at $0.2129 on Tuesday, holding a constructive near-term bullish bias. The CRV token tests the 50% retracement level at $0.2232, measured from $0.2931 to $0.1700. A decisive close above this level could target overhead barriers, including the 78.6% Fibonacci retracement at $0.2608, followed by the 200-day EMA at $2814.
The Relative Strength Index (RSI) at 60 indicates firm bullish momentum without reaching overbought territory, while the Moving Average Convergence Divergence (MACD) maintains an upward trend, with its signal line and expanding histogram, suggesting that buyers retain trend control.
On the downside, initial support is seen at the 50-day EMA at $0.2129, followed by the 23.6% Fibonacci retracement at $0.1933.
(The technical analysis of this story was written with the help of an AI tool. Know more.)














