

Crude Oil fades another war spike as the ceasefire dies its daily death
- WTI Crude Oil trades near $71.00, down 1%, after a morning spike to $72.83 was sold back to the session low inside two hours.
- The International Energy Agency forecasts the first annual decline in worldwide demand since 2020, recasting the war as demand destruction rather than a supply squeeze.
- President Trump repeats that the ceasefire is over and Tehran denies rumours of fresh talks, yet the risk premium shrinks with every rerun.
West Texas Intermediate (WTI) Crude Oil trades at $70.98 on Friday, down 1%, after a European-morning climb to $72.83 met a wall of New York selling that drove the barrel to a $70.70 session low inside two hours. The escalation premium built off the $68.00 base earlier in the week is still intact on paper, and Friday's tape is eating it in real time, on a day when the news flow should have paid sellers to stay home.

A war that no longer clears the headline bar
The raw material of a supply scare is all present and accounted for. US forces have struck Iranian targets more than 170 times in two days, Tehran has fired ballistic missiles at a base in Jordan and attacked commercial vessels around the Strait of Hormuz, and tanker traffic through the chokepoint has slowed to a trickle while hundreds of stranded ships await clearance.
President Trump repeated on Friday morning that the ceasefire is over, recycling Wednesday's declaration in a social media post, while Iranian sources rejected rumours that a fresh round of talks is scheduled for next week. Qatar and Pakistan are working to drag both sides back to the table, Oman and Turkey are fielding calls from Tehran, and Washington maintains that technical talks continue regardless. Iran also buried its former supreme leader on Friday, a succession moment that in any prior decade would have added dollars to the barrel on its own.
The market sold all of it. Thursday's tape cooled on a claim that Iran had called to negotiate, Friday's push above $72.50 lasted roughly the length of a lunch order, and each escalation now buys fewer dollars per barrel and holds them for less time than the one before it. Positioning explains part of the decay; a market that spent June erasing its entire wartime premium has little appetite to rebuild it on rhetoric alone.
The International Energy Agency turns the bull case inside out
Friday's monthly report from the International Energy Agency (IEA) put a number on what the tape already suspected: worldwide demand for Crude Oil and refined products is set to fall by 1 million barrels per day in 2026, the first annual decline since 2020, with the contraction skewed heavily toward the products and regions the Hormuz closure hit hardest. Supply is healing faster than consumption, having rebounded by 4.1 million barrels per day in June to 98.8 million as flows through the Strait resumed, though output remains 9.4 million barrels per day below pre-war levels.
The agency's forward math is worse for bulls than its history. The balance swings back to surplus toward the end of the year and into a significant 2027 overhang if transit volumes keep recovering, and the entire projection is explicitly contingent on a lasting peace that nobody is currently signing. De-escalation therefore fast-forwards the glut, renewed escalation deepens the demand destruction, and only a full, sustained loss of the Strait genuinely re-prices supply. Traders have now watched two shutdowns of the waterway fail to stick.
Beneath the headline, the report describes a crude market that is loose and a products market that is not, with refinery margins and gasoline cracks running at multi-year highs while damaged Gulf refining capacity limps back online. That squeeze rewards refiners rather than the barrel itself; for WTI, tight products are a consolation prize, not a bid.
Next week trades on Washington data, not Gulf rhetoric
June's US Consumer Price Index (CPI) lands Tuesday at 12:30 GMT, and it matters for the barrel twice over: May's 4.2% YoY headline was driven substantially by war-inflated energy costs, and a hot repeat would keep the Fed hawkish and the Dollar firm, a standing headwind for Crude Oil. The Fed chair testifies at 14:00 GMT on Tuesday and Wednesday, with US retail sales due Thursday at 12:30 GMT.
On the supply side, the weekly Energy Information Administration (EIA) inventory report lands Wednesday at 14:30 GMT and the Baker Hughes rig count arrives later Friday at 17:00 GMT. The genuine red-band release remains unscheduled: Hormuz tanker-tracking data has replaced the calendar as the market's real tape, and it prints continuously.
Crude Oil technical levels
Resistance: Friday's rejected spike at $72.83 caps the tape under the $73.00 handle. Above it the air stays thin until $76.00, where June's breakdown began, with the falling 200-day Exponential Moving Average just behind at $77.28.
Support: The session low at $70.70 defends the $70.00 handle. Below that, the late-June base at $68.00 is the level the entire rebound is built on, and a daily close beneath it would put the February trough near $62.00 back on the map.
Bias: Lower. Sellers are meeting strength on schedule while $73.00 caps, and although the daily Stochastic Relative Strength Index curling up from oversold near 28 argues against chasing weakness, the path of least resistance runs back toward $68.00; only a daily close above $73.00 forces shorts to reconsider.
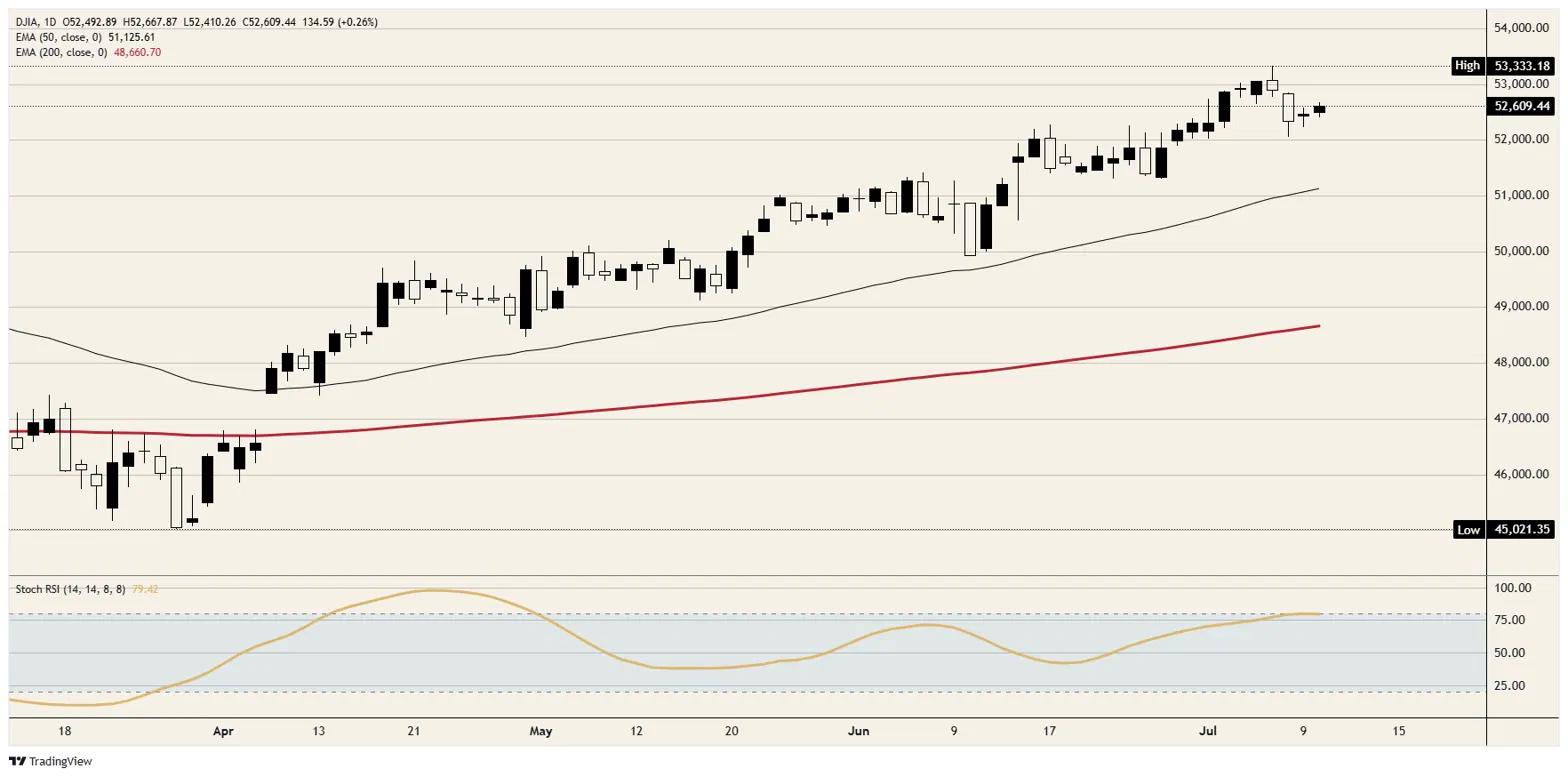
Dow Jones daily chart
Dow Jones FAQs
The Dow Jones Industrial Average, one of the oldest stock market indices in the world, is compiled of the 30 most traded stocks in the US. The index is price-weighted rather than weighted by capitalization. It is calculated by summing the prices of the constituent stocks and dividing them by a factor, currently 0.152. The index was founded by Charles Dow, who also founded the Wall Street Journal. In later years it has been criticized for not being broadly representative enough because it only tracks 30 conglomerates, unlike broader indices such as the S&P 500.
Many different factors drive the Dow Jones Industrial Average (DJIA). The aggregate performance of the component companies revealed in quarterly company earnings reports is the main one. US and global macroeconomic data also contributes as it impacts on investor sentiment. The level of interest rates, set by the Federal Reserve (Fed), also influences the DJIA as it affects the cost of credit, on which many corporations are heavily reliant. Therefore, inflation can be a major driver as well as other metrics which impact the Fed decisions.
Dow Theory is a method for identifying the primary trend of the stock market developed by Charles Dow. A key step is to compare the direction of the Dow Jones Industrial Average (DJIA) and the Dow Jones Transportation Average (DJTA) and only follow trends where both are moving in the same direction. Volume is a confirmatory criteria. The theory uses elements of peak and trough analysis. Dow’s theory posits three trend phases: accumulation, when smart money starts buying or selling; public participation, when the wider public joins in; and distribution, when the smart money exits.
There are a number of ways to trade the DJIA. One is to use ETFs which allow investors to trade the DJIA as a single security, rather than having to buy shares in all 30 constituent companies. A leading example is the SPDR Dow Jones Industrial Average ETF (DIA). DJIA futures contracts enable traders to speculate on the future value of the index and Options provide the right, but not the obligation, to buy or sell the index at a predetermined price in the future. Mutual funds enable investors to buy a share of a diversified portfolio of DJIA stocks thus providing exposure to the overall index.














