


What Is a Shooting Star Candlestick Pattern?
The shooting star candlestick refers to a candlestick pattern used in technical analysis where the uptrend reverses into a downtrend after printing it. A shooting star candlestick can be red or green.
A red body is usually stronger because it shows sellers finished the session in clearer control, but the wick and the location matter more than the body color alone.
Key Components and Stronger Pattern Traits
A valid shooting star candlestick pattern usually has four core parts.
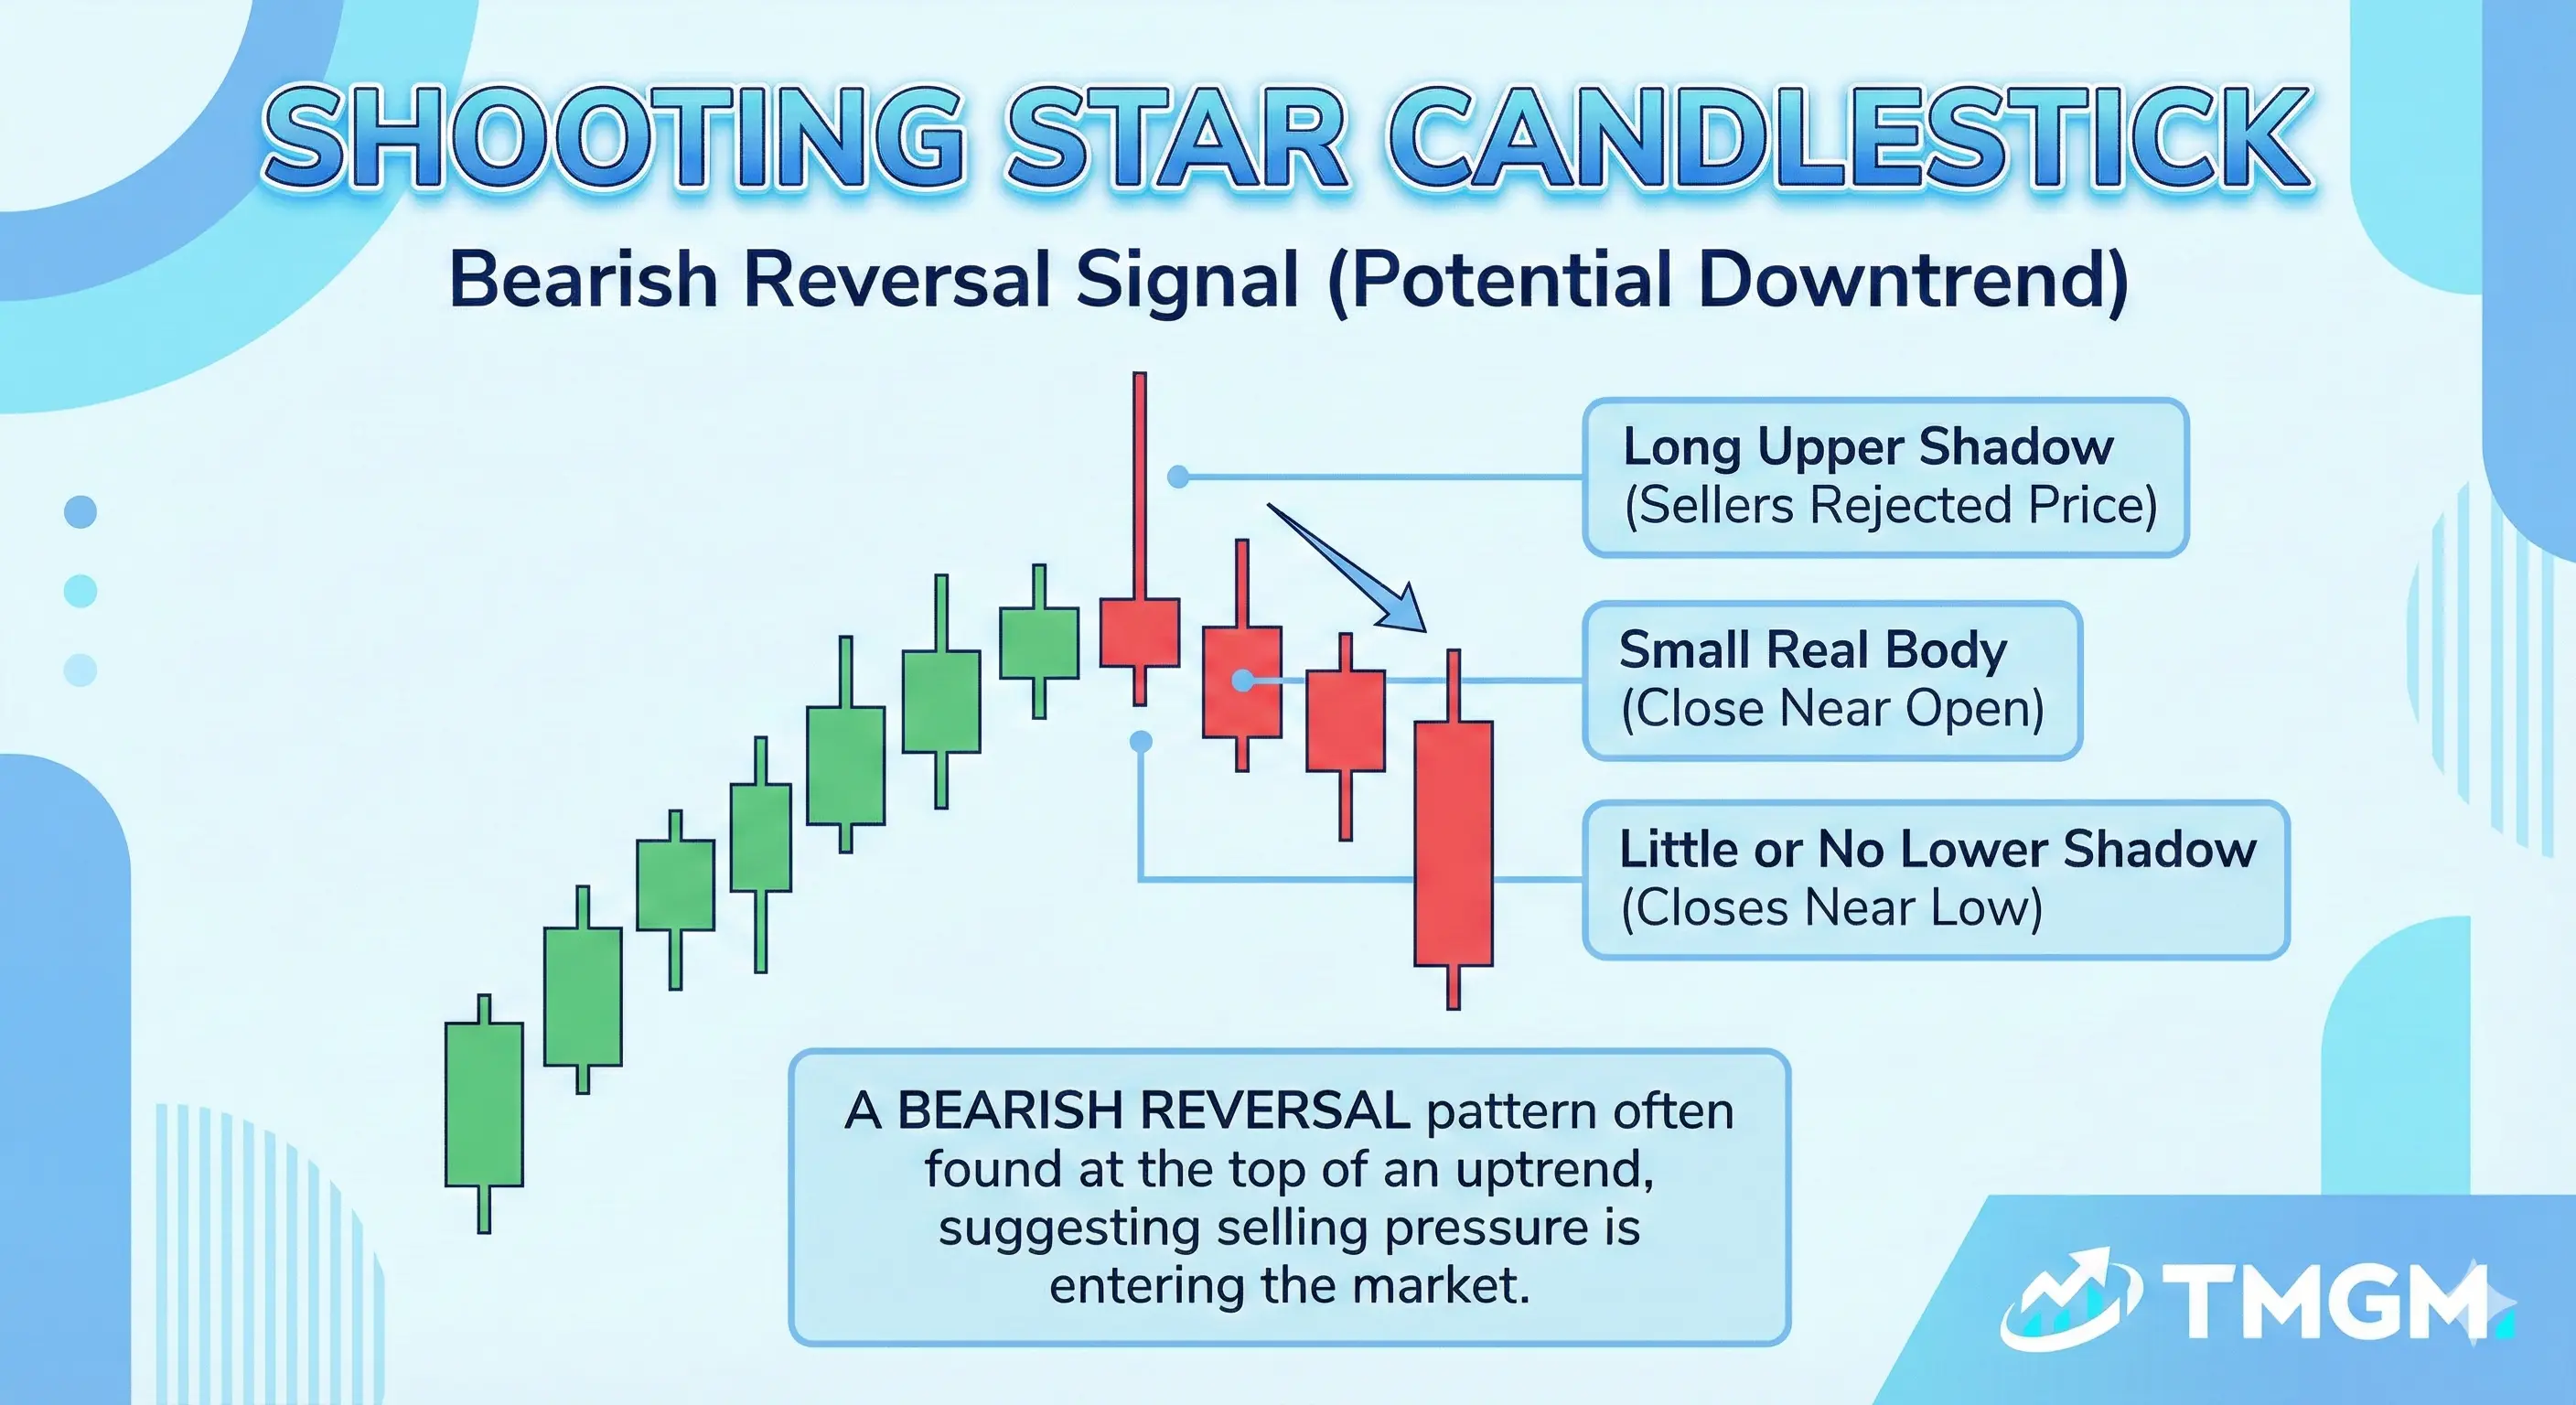
A small real body near the low of the candle
A long upper wick, often at least twice the body size
Little or no lower wick
A prior move upward before the pattern forms
The best form of shooting star candlestick pattern closes below the opening price. That does not make a green candle invalid, but a red close gives the pattern more bearish weight.
How to Validate Shooting Star Candlestick Pattern?
A shooting star is a warning candle. The next few candles show better whether sellers actually took control.
A classic confirmation is a strong bearish follow through candle after the shooting star. That second candle should close lower and ideally break below the shooting star low or body.
Resistance matters just as much as the candle shape. The pattern becomes more credible when it forms near a prior swing high, a supply zone, a Fibonacci level, or a moving average that has acted as resistance before.
Technical Indicators help to clarify trading bias a lot. For example, RSI adds useful context when it is rolling down from an overbought area, often above 70. Stochastic helps in a similar way when it turns down from an overbought reading, while MACD is more useful when the histogram is fading or a bearish crossover is starting after a mature rally.
Volume can strengthen the bias. A higher than normal volume spike on the shooting star or on the bearish confirmation candle suggests stronger distribution and more serious rejection.
ImportantA shooting star without bearish follow through is only a warning, not a completed reversal signal.
Interpretation of Shooting Start Candlestick Pattern
The price action interpretation is straightforward. Buyers were strong enough to push price higher, but that strength faded before the candle closed. Sellers then forced price back down and left trapped late buyers near the highs.
That shift in control is why the pattern is bearish. The upper shadow marks a failed attempt to continue the rally, and the small body near the low shows that the market did not accept those higher prices.
A single candle does not guarantee a reversal. What it does is reveal a change in auction behavior. Instead of smooth upward acceptance, the market started rejecting higher prices.
How to Trade a Shooting Star Candlestick Pattern
Identify
First, make sure the pattern appears after a real upward move. A shooting star after a flat range or after a decline is lower quality and often misread.
Confirmation at Resistance
The best trades come when the candle forms into a resistance area. That could be a prior high, a supply zone, a major moving average, a trendline, or a clear horizontal level.
Enter
The most common entry is below the low of the shooting star or below the low of the bearish confirmation candle. That approach waits for the market to prove that sellers are actually taking control.
More aggressive traders sometimes enter on a small retest of the shooting star body. That can improve reward, but it also increases the chance of getting caught in a failed reversal.
Stop Loss
A logical stop loss usually sits above the high of the shooting star. Some traders add a small volatility buffer above the wick to avoid getting taken out by a minor sweep.
Take Profit 1
Take profit 1 is usually the nearest support area, a recent swing low, or a fixed risk reward target such as 2R. TP1 allows traders to exit the position partially, securing the cost and let the profits run.
Take Profit 2
Take profit 2 can sit at the next major support level or at a deeper swing low if the broader trend is turning.
Pro Tip: Shooting star trades usually fail fast or work fast. If price cannot break lower soon after confirmation, be prepared to close the trade.
Pros and Cons
Pros
• Easy to spot on the chart
• Works well near clear resistance
• Gives a precise invalidation point above the wick
• Becomes stronger when combined with momentum and volume clues
Cons
• Weak in sideways markets
• Produces many false signals without confirmation
• Can be trapped by news driven spikes and quick reversals
• Needs context from other angles like technical indicators, not just pattern recognition
Shooting Star vs Inverted Hammer
The shooting star and inverted hammer candlestick confusion happens because both candles look very similar. They both have a small body near the low and a long upper shadow.
The difference is location. A shooting star appears after an uptrend and signals possible bearish reversal. An inverted hammer appears after a downtrend and signals a possible bullish reversal attempt.
There is no widely accepted separate pattern called an inverted shooting star candlestick. In most cases, traders are either referring to a normal shooting star or confusing it with an inverted hammer.
Some traders also search for a bullish shooting star candlestick pattern, but that is not the standard interpretation. A green shooting star can still be bearish if it forms after an uptrend. The true bullish look alike is usually the inverted hammer.
Common Mistakes and Pro Tips
The first common mistake is trading every shooting star the same way. Individual market context is important for every trade.
The second mistake is entering before confirmation. The wick may look bearish, but if the next candle closes strong and reclaims the high, the pattern has failed.
The third mistake is ignoring trend strength. A shooting star against a powerful trend can lead to only a short pullback instead of a full reversal. Traders should judge the trend from a higher timeframe before having any expectations.
The fourth mistake is relying too heavily on indicators. RSI, MACD, and Stochastic can support the read, but they do not replace price structure, resistance, and follow through.
FAQ
What does a shooting star candlestick mean?
A shooting star candlestick means price was pushed higher but then rejected before the close. It often signals that buying pressure is fading and that sellers may be taking control near a local top.
Is a shooting star candlestick bearish or bullish?
A shooting star is usually bearish when it appears after an uptrend. A green body does not automatically make it bullish. The pattern is still read as a bearish warning if it forms after a rally and gets bearish confirmation.
What is the difference between a shooting star and an inverted hammer?
The shape is similar, but the context is different. A shooting star candlestick pattern forms after an uptrend and warns of bearish reversal, while an inverted hammer forms after a downtrend and suggests a possible bullish reversal attempt.