


Chart Patterns at a Glance
1Why traders use chart patterns: They help traders identify trend direction, spot possible reversals, and organise entries, stop loss levels, and profit targets.
2Chart patterns vs candlestick patterns: Chart patterns describe broader price structure across many candles, while candlestick patterns give short term confirmation.
3Types of chart patterns: The main groups are continuation, reversal, and bilateral patterns, each with a different trade expectation.
4How to trade them: Strong chart pattern trading depends on confirmation, clear risk management, realistic targets, and accepting that no pattern guarantees an outcome.
Why Traders Use Chart Patterns
Chart patterns matter because they turn raw price movement into a repeatable structure. A trader can use that structure to judge whether a market is consolidating, trending, exhausting, or preparing for a breakout.
To identify trend direction
A pattern often shows whether the existing move is holding or weakening. Flags, pennants, and rectangles usually appear when a trend pauses and may continue, while head and shoulders or double tops can signal that momentum is fading.
To spot reversals and continuation
The practical use of chart patterns is not just naming shapes. The real use is reading whether price is more likely to continue in the same direction, reverse, or break either way after compression.
To plan trade decisions
Chart patterns also help traders define execution levels. A trader can map the entry area, the invalidating level, and the take profit zone before placing a trade, which is far more useful than reacting after price has already moved.
This logic applies across stocks, indices, forex pairs, and commodities, whether the trader is using intraday, swing, or positional timeframes.
Chart Patterns vs Candlestick Patterns
Chart patterns are larger price structures built from many candles over time. Candlestick patterns are smaller formations, often built from one to three candles, that help confirm short term intent near an important level.
A double bottom or ascending triangle can take many sessions to form. A hammer, engulfing candle, or doji gives more granular information about rejection, hesitation, or momentum at the key decision point.
Important: A chart pattern defines the structure, but a candlestick pattern often helps confirm the trigger.
The strongest technical reading usually comes from combining both. A trader may identify a broad bull flag on the chart, then use a bullish engulfing candle or a strong breakout close to refine the entry.
What Are the Main Types of Chart Patterns?
Chart patterns usually fall into three groups: continuation patterns, reversal patterns, and bilateral patterns. This classification helps traders judge whether price is more likely to resume the existing trend, reverse direction, or stay neutral until a confirmed breakout appears.
Continuation Chart Patterns
Continuation chart patterns form when price pauses within an existing trend instead of fully changing direction. Traders use them to assess whether a consolidation phase is likely to resolve in the direction of the prior move.
Cup and Handle Pattern

A cup and handle pattern is a bullish continuation formation that develops when price rounds into a base and then pulls back slightly beneath resistance.
Image placeholder: Cup and Handle Pattern
The structure often shows that buyers are absorbing supply before another attempt higher. Traders usually look for a breakout above the handle high, while a deep handle or a failed breakout weakens the setup.
Inverted Cup and Handle Pattern
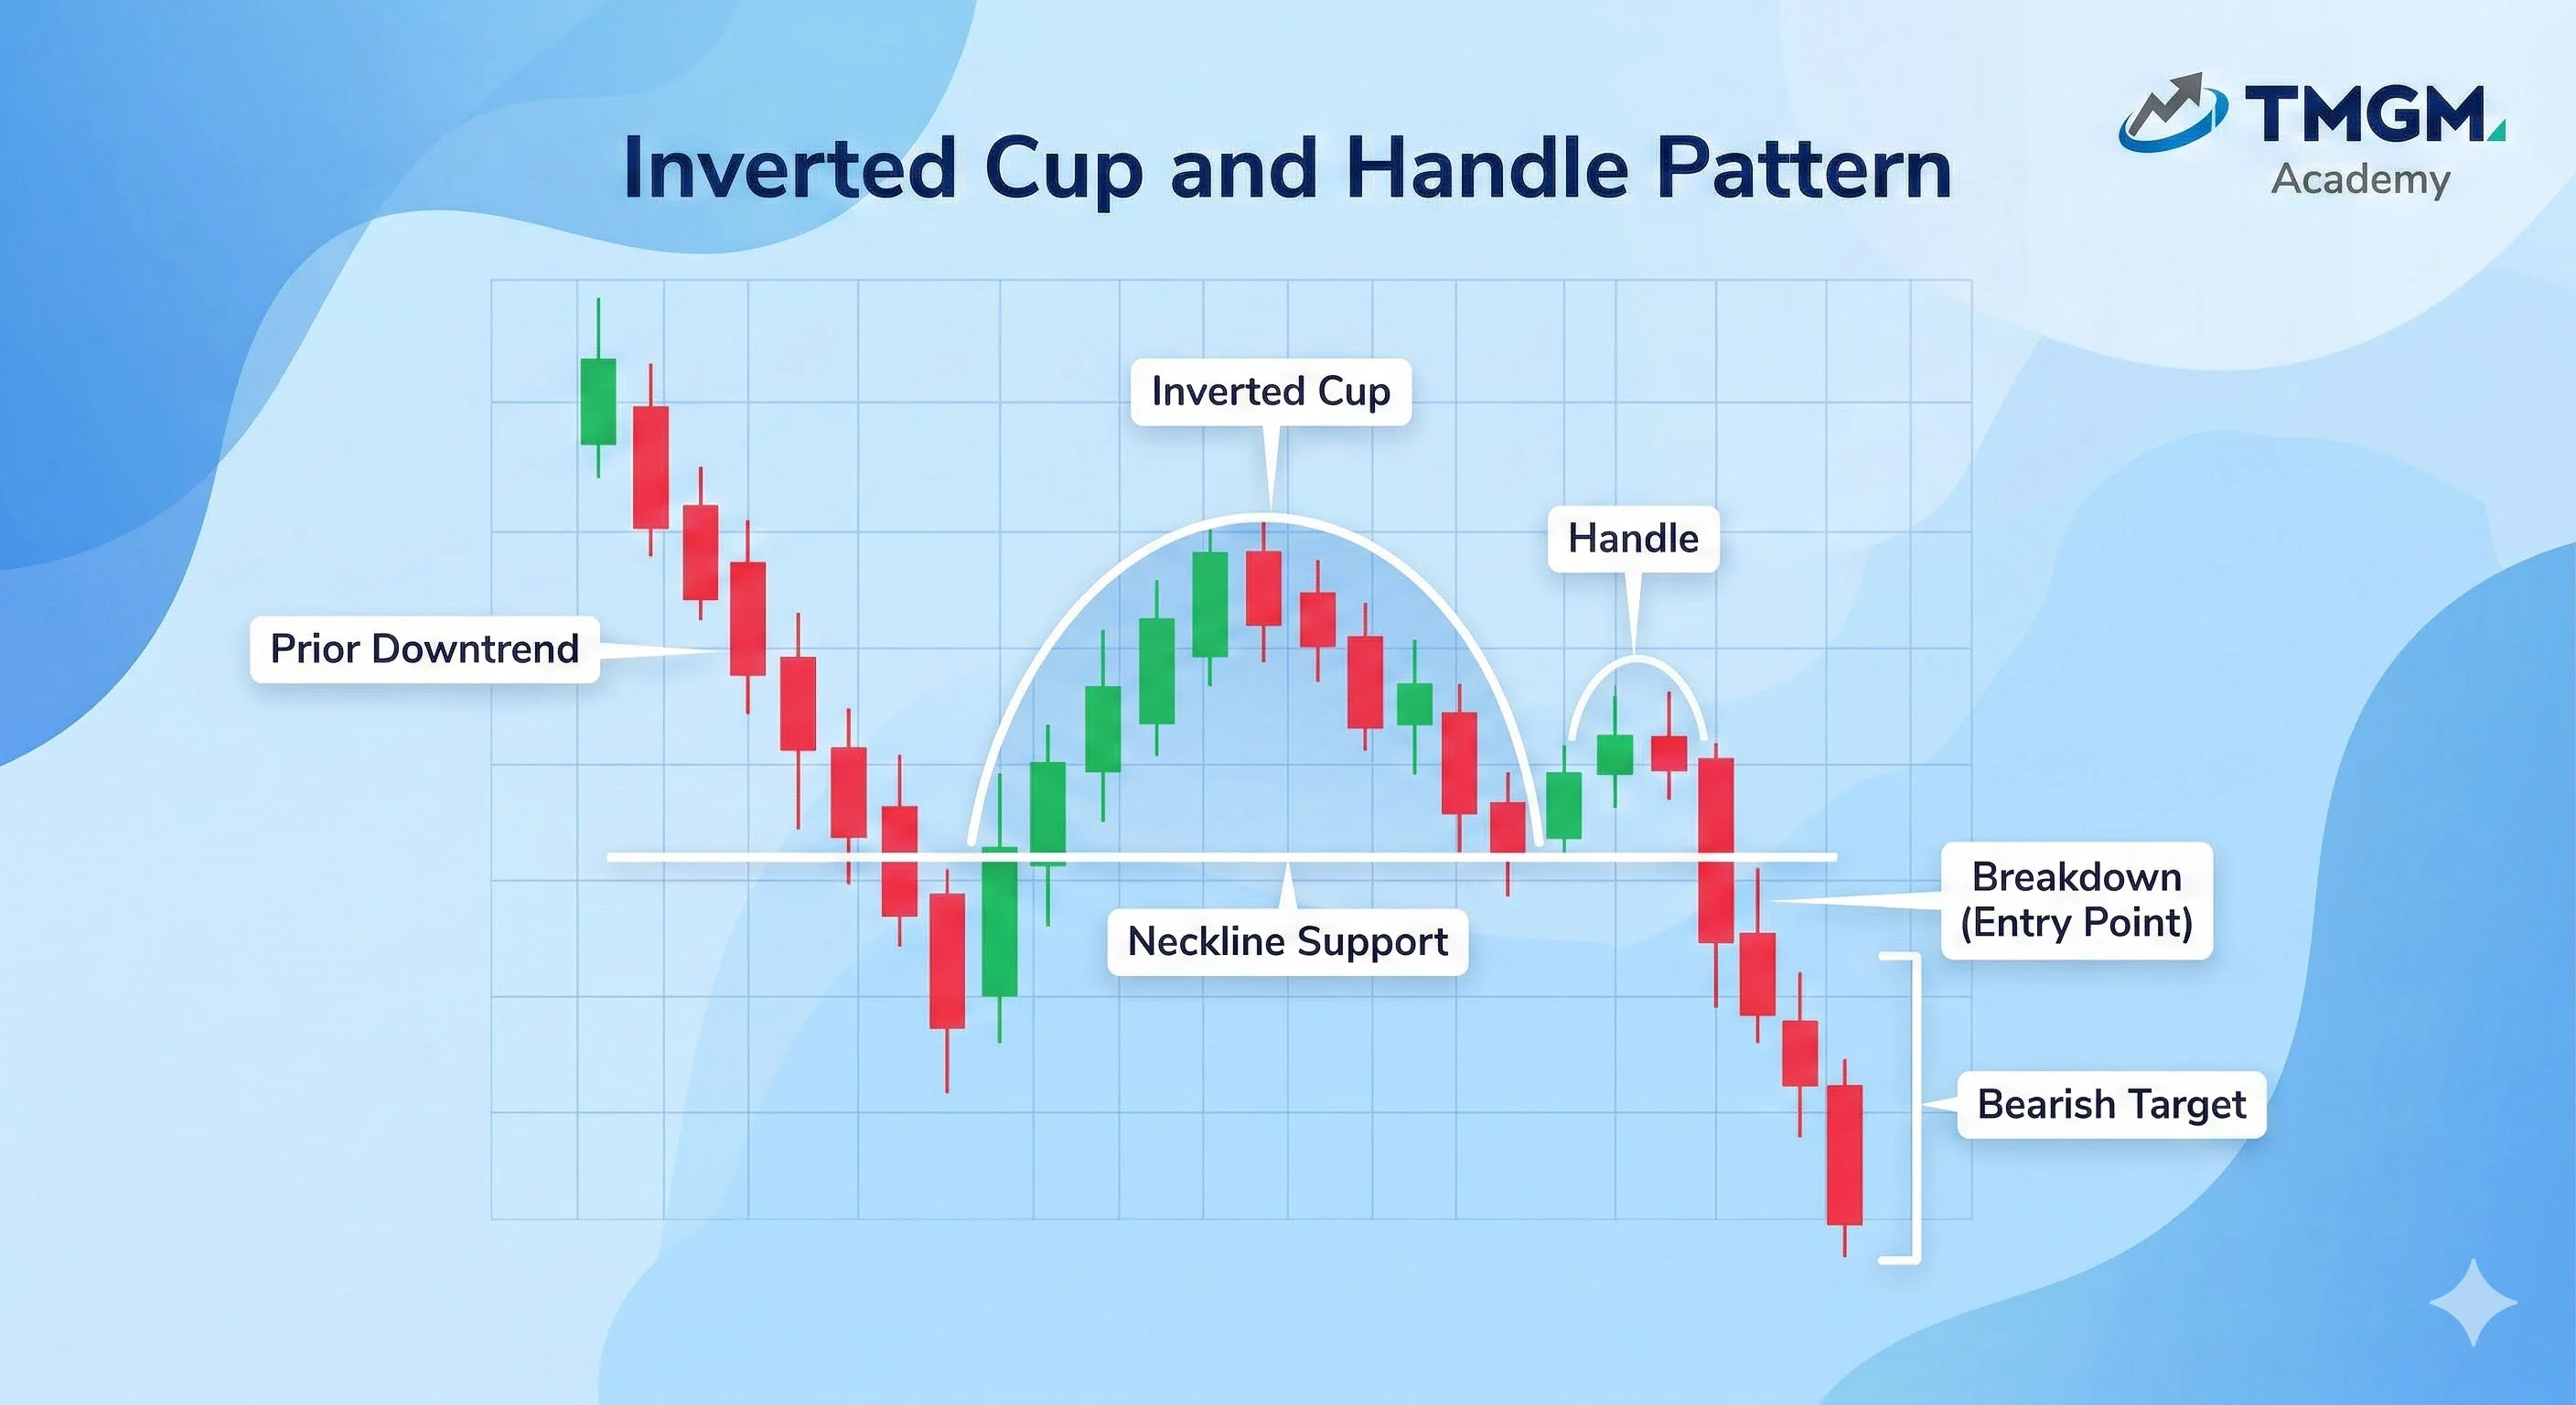
An inverted cup and handle pattern is a bearish continuation formation that appears when price rounds lower and then retraces modestly before retesting support.
Image placeholder: Inverted Cup and Handle Pattern
The structure often shows that sellers still control the broader move. Traders usually look for a clean break below the handle support, while a strong recovery above the handle zone weakens the bearish view.
Bull Flag Pattern
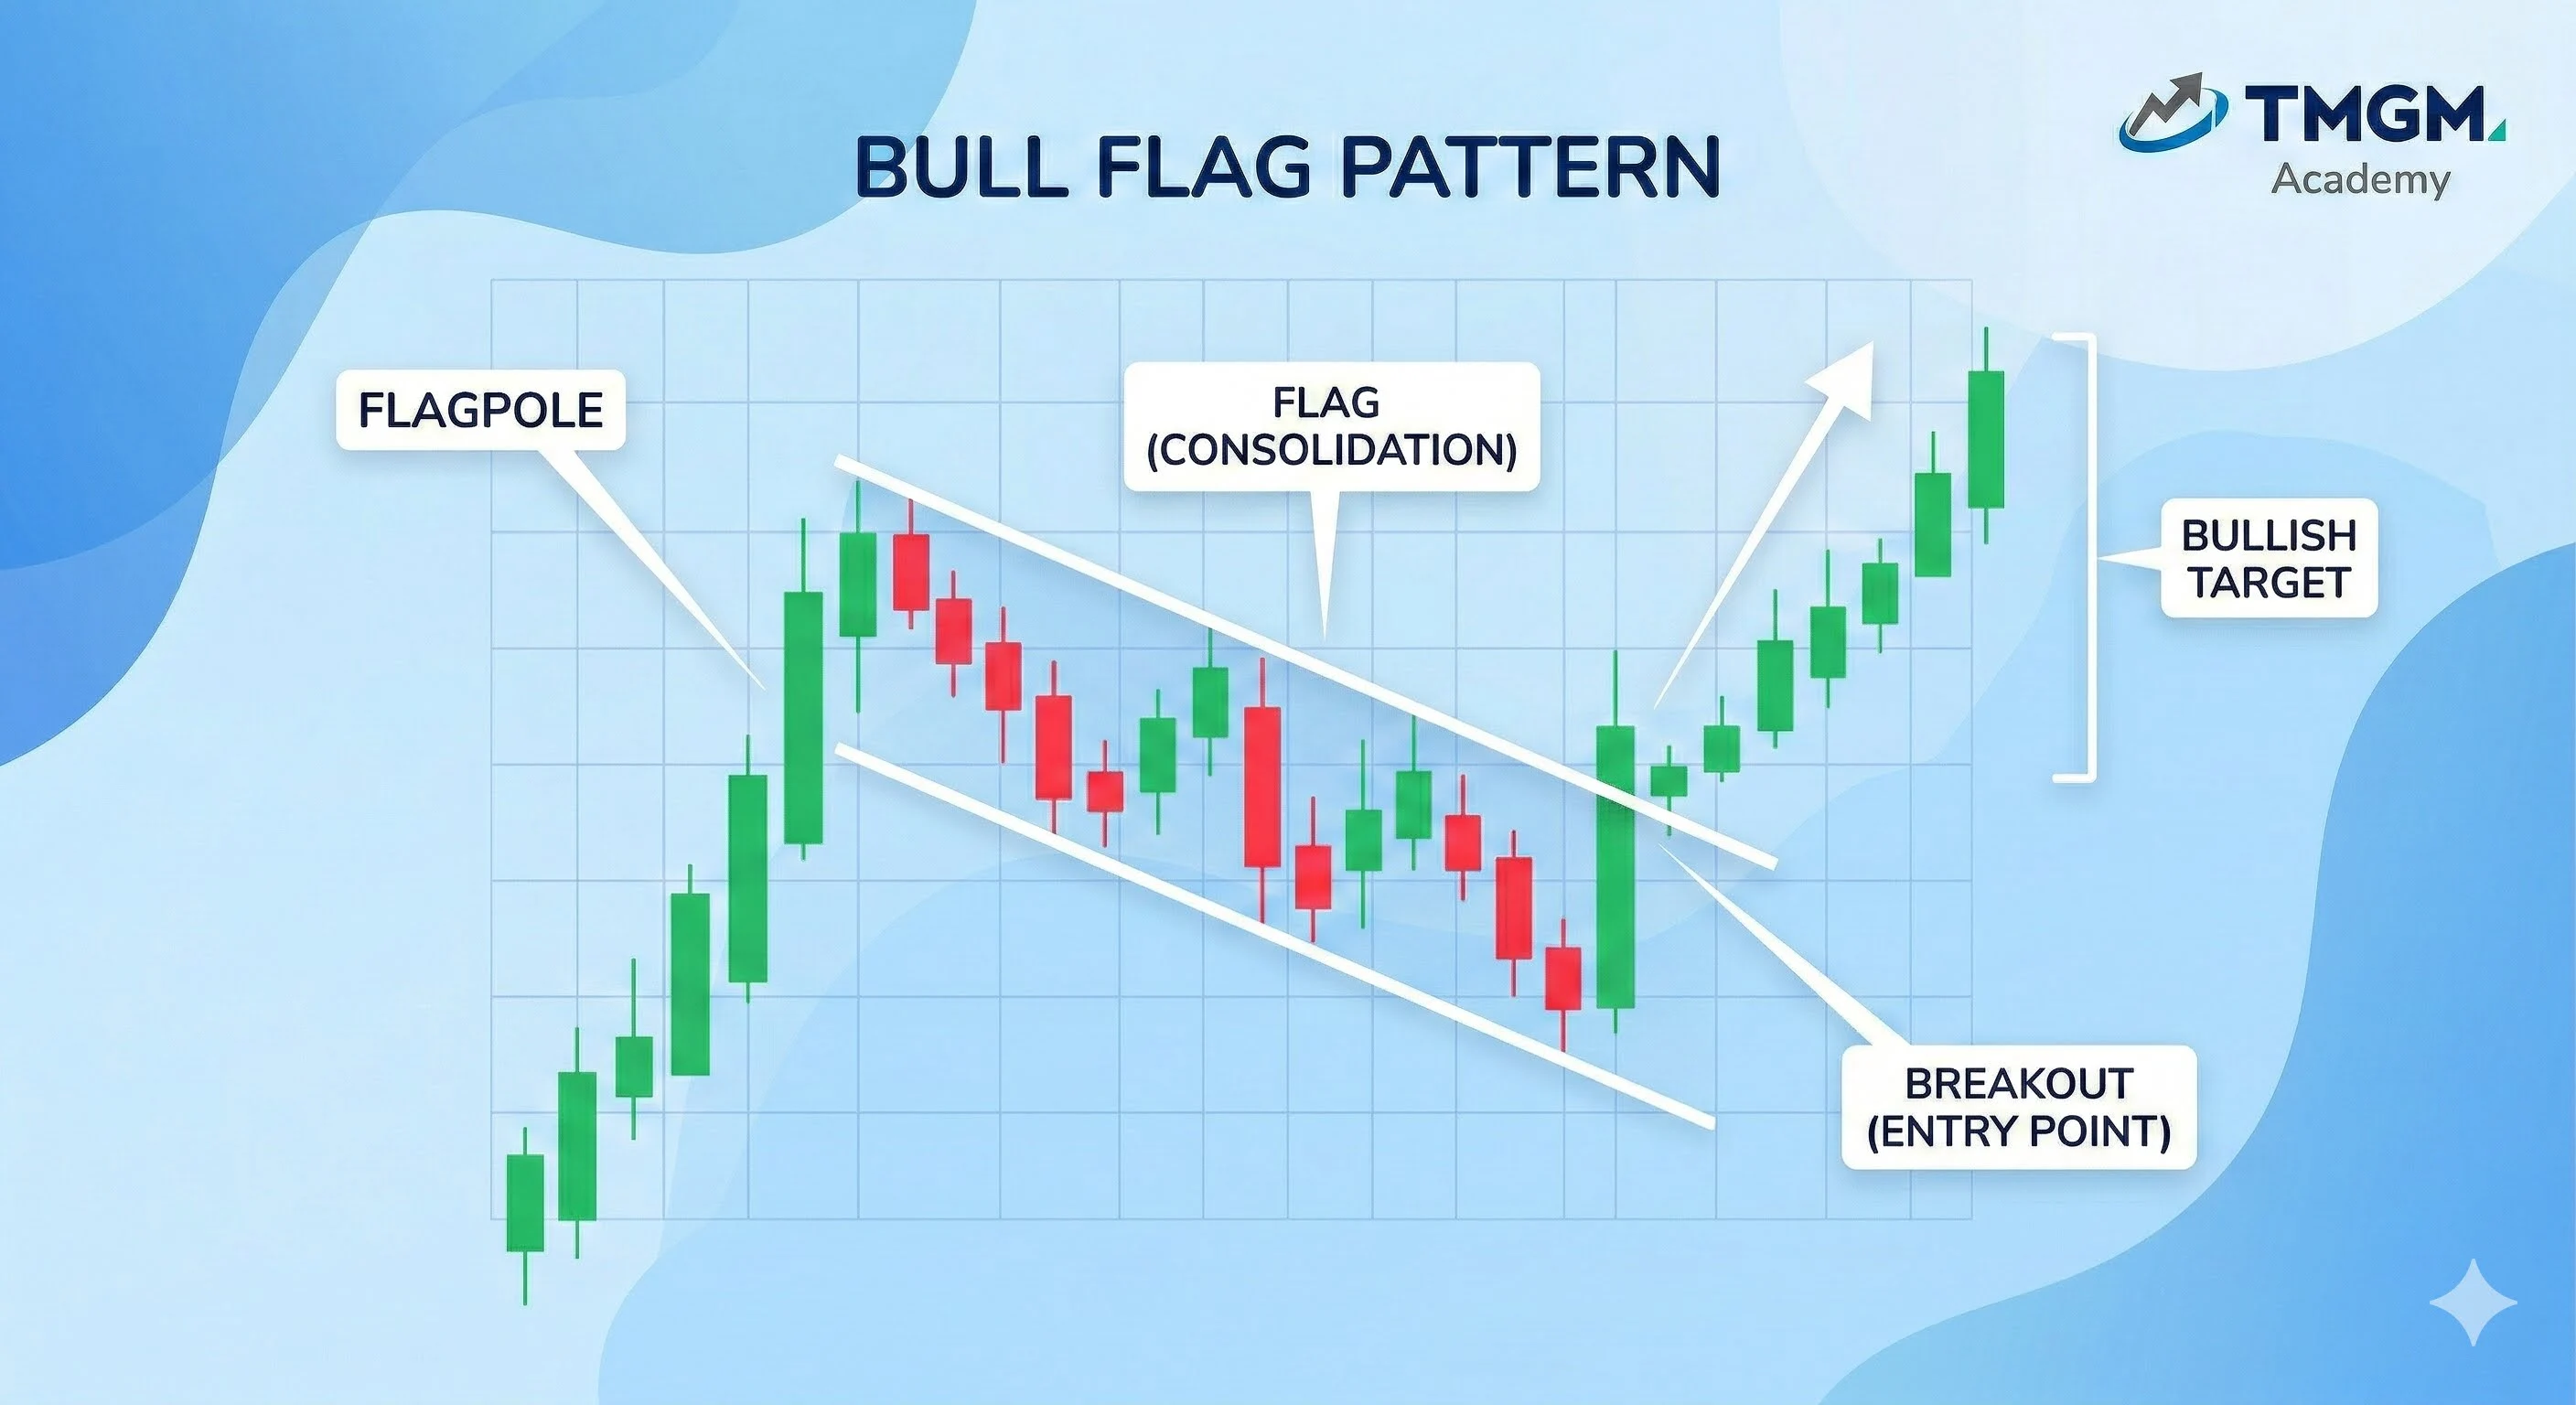
A bull flag pattern forms after a sharp upward move, followed by a short downward sloping or sideways consolidation within the broader uptrend.
Image placeholder: Bull Flag Pattern
The pattern usually signals a pause rather than a reversal. Traders often wait for price to break above flag resistance, while a deep pullback into the flagpole reduces the strength of the continuation signal.
Bear Flag Pattern

A bear flag pattern forms after a strong decline, followed by a brief upward sloping or sideways consolidation within the broader downtrend.
Image placeholder: Bear Flag Pattern
The pattern usually signals a pause before another move lower. Traders often wait for a break below flag support, while a strong recovery above the consolidation range weakens the bearish case.
Bullish Pennant Pattern

A bullish pennant pattern forms after a strong upward impulse, then contracts into a small triangle as volatility tightens.
Image placeholder: Bullish Pennant Pattern
The pattern usually signals continuation if price breaks above the pennant with clear follow through. A weak breakout or an extended sideways drift lowers the quality of the setup.
Bearish Pennant Pattern

A bearish pennant pattern forms after a sharp downward impulse, then compresses into a narrow triangle before the next directional move.
Image placeholder: Bearish Pennant Pattern
The pattern usually signals continuation if price breaks below the lower pennant boundary with conviction. If price stalls too long or reclaims the structure, the bearish setup becomes less reliable.
Bullish Rectangle Pattern

A bullish rectangle pattern forms when price moves sideways between parallel support and resistance after an earlier uptrend.
Image placeholder: Bullish Rectangle Pattern
The pattern usually shows consolidation before a possible continuation higher. Traders often wait for a breakout above resistance, while repeated rejection and a break below support weaken the bullish outlook.
Bearish Rectangle Pattern
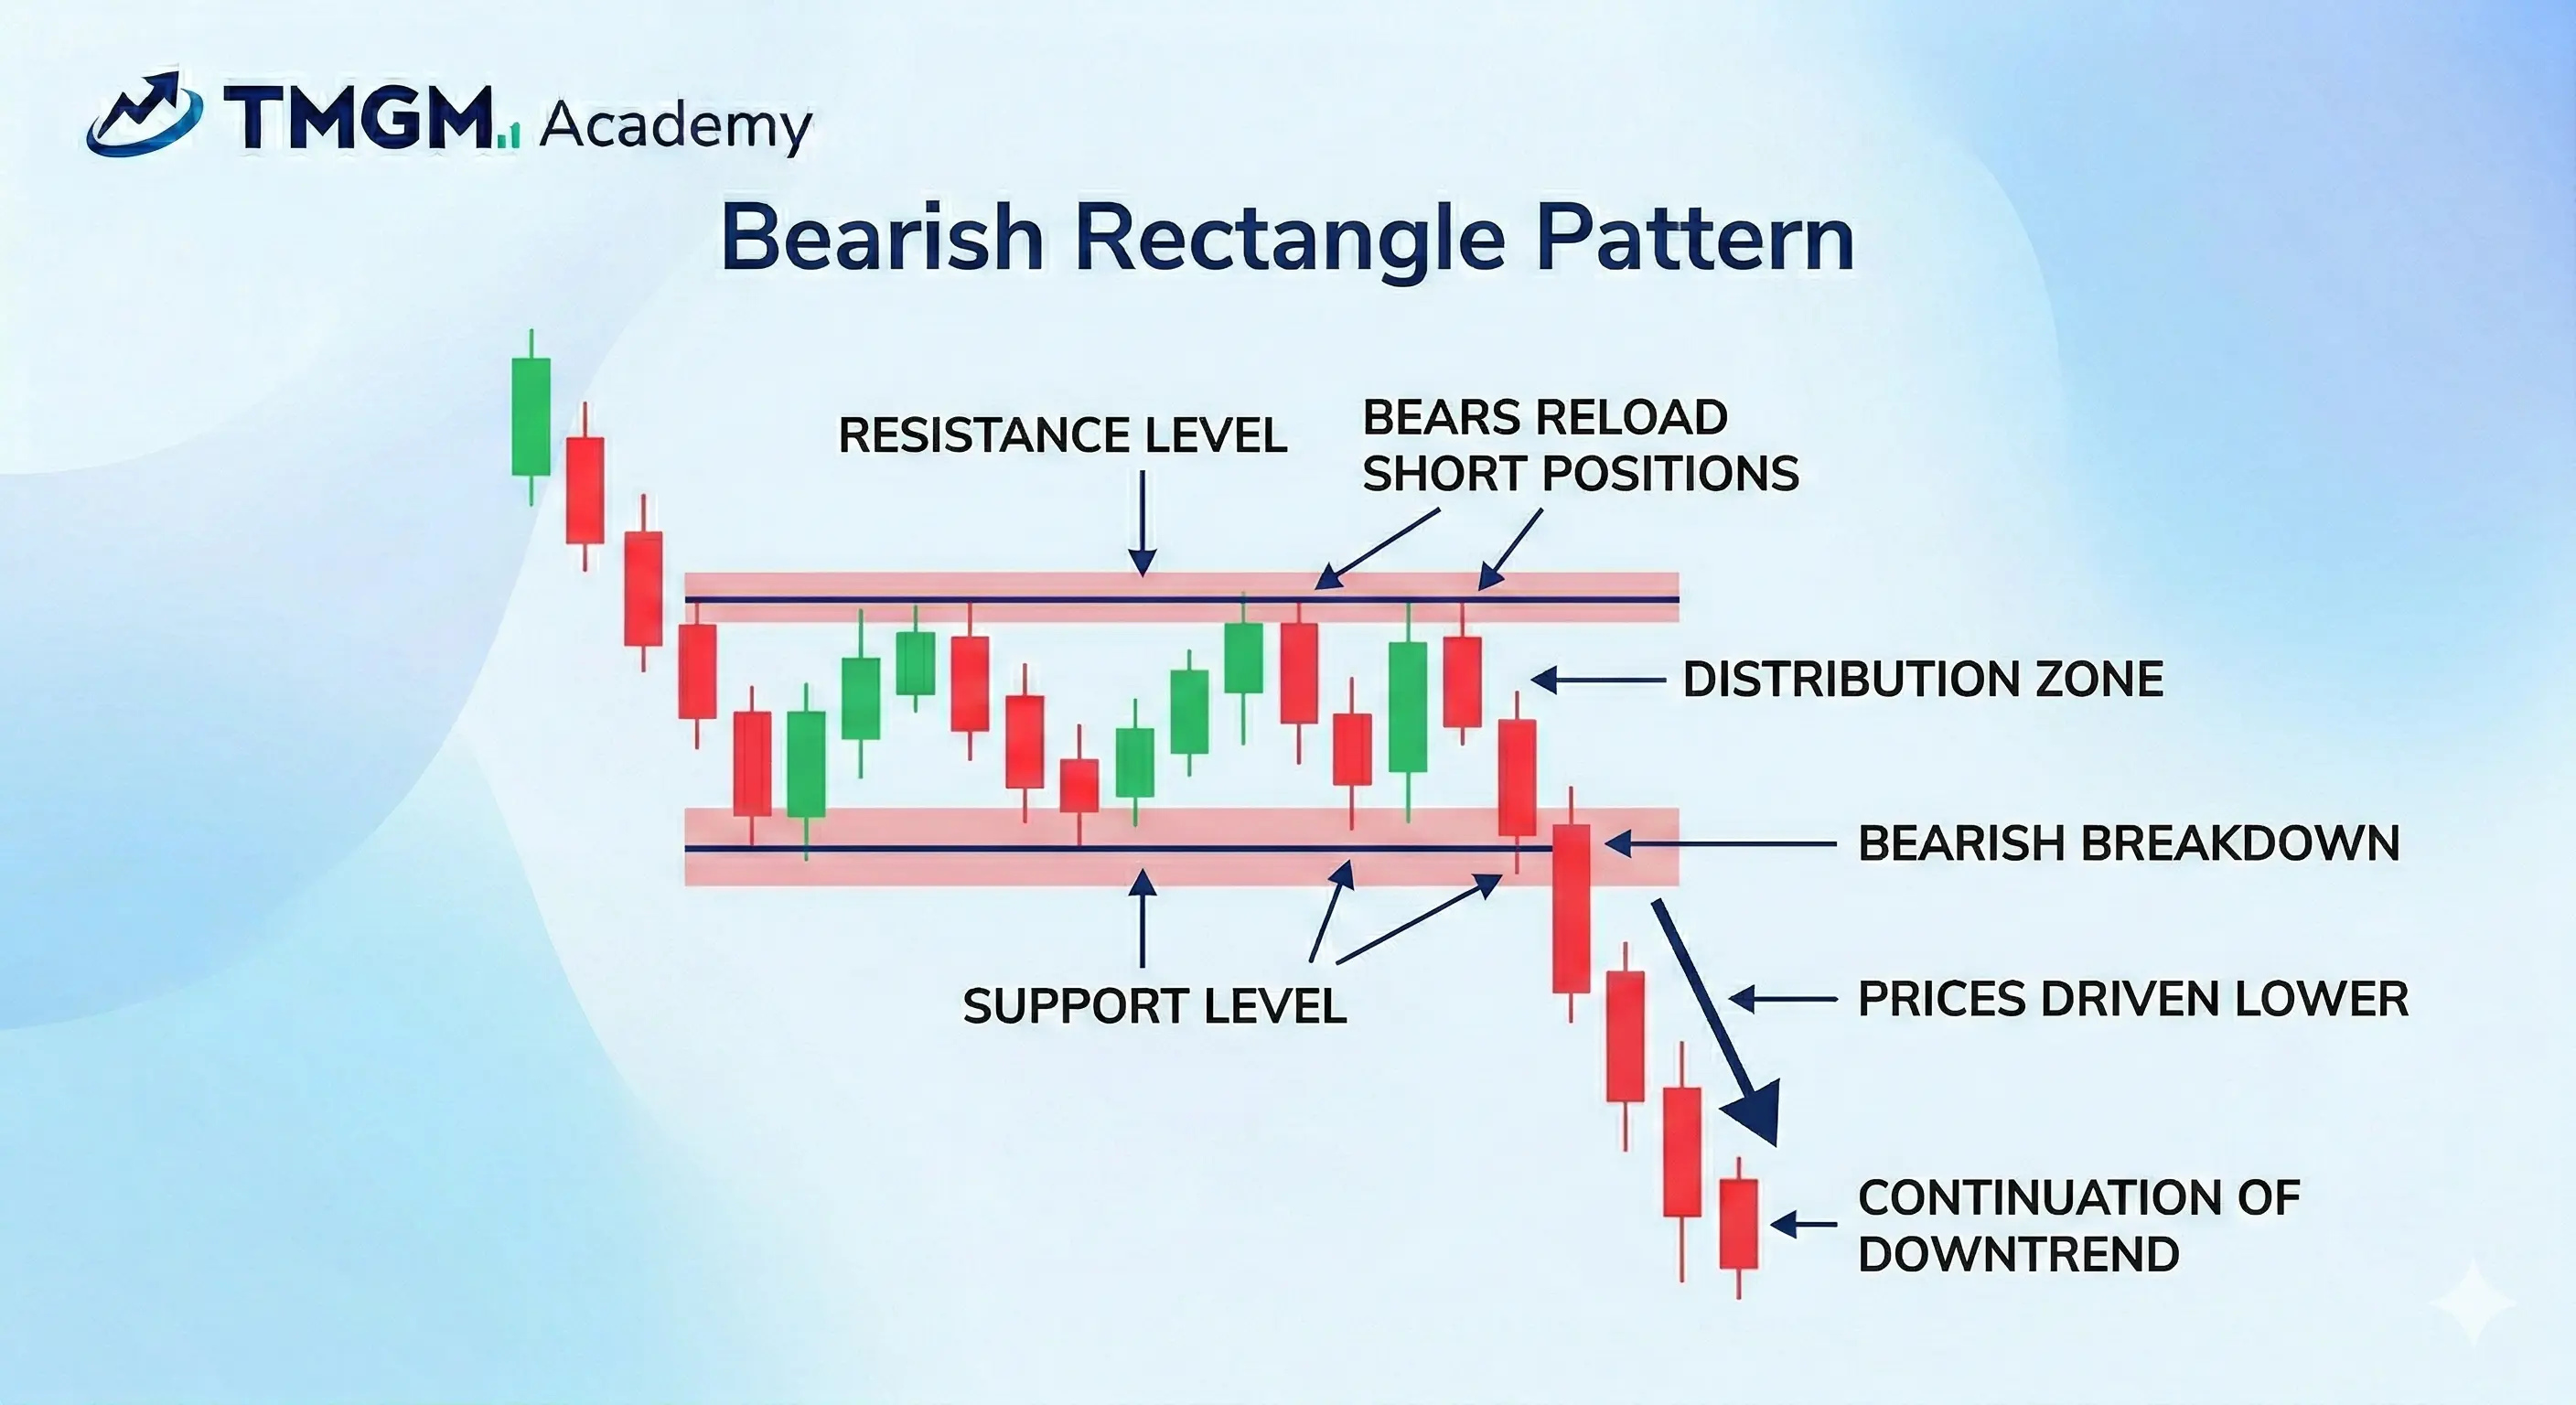
A bearish rectangle pattern forms when price trades sideways between horizontal boundaries after an earlier decline.
Image placeholder: Bearish Rectangle Pattern
The pattern usually shows consolidation before a possible continuation lower. Traders often wait for a break below support, while a breakout above resistance weakens the bearish view.
Reversal Chart Patterns
Reversal chart patterns form when the existing trend starts losing momentum and price begins to challenge the structure that supported the prior move. Traders use them to identify potential turning points, but confirmation matters more than the label itself.
Head and Shoulders Pattern

A head and shoulders pattern is a bearish reversal structure made up of three peaks, with the middle peak rising above the two outer peaks.
Image placeholder: Head and Shoulders Pattern
The pattern usually signals that buying pressure is fading after an uptrend. Traders often treat a break below the neckline as confirmation, while a move back above the right shoulder weakens the bearish reversal case.
Inverse Head and Shoulders Pattern

An inverse head and shoulders pattern is a bullish reversal structure made up of three troughs, with the middle trough falling below the two outer troughs.
Image placeholder: Inverse Head and Shoulders Pattern
The pattern usually signals that selling pressure is fading after a downtrend. Traders often wait for a break above the neckline, while a drop back below the right shoulder weakens the bullish reversal view.
Double Top Pattern

A double top pattern forms when price tests a resistance area twice and fails to continue higher, creating an M shaped structure.
Image placeholder: Double Top Pattern
The pattern usually signals that the uptrend is losing strength near resistance. Traders often wait for a break below the neckline or support base, while a breakout above the second peak invalidates the setup.
Double Bottom Pattern

A double bottom pattern forms when price tests a support area twice and fails to continue lower, creating a W shaped structure.
Image placeholder: Double Bottom Pattern
The pattern usually signals that the downtrend is losing strength near support. Traders often wait for a break above neckline resistance, while a fresh move below the second low weakens the reversal signal.
Triple Top Pattern
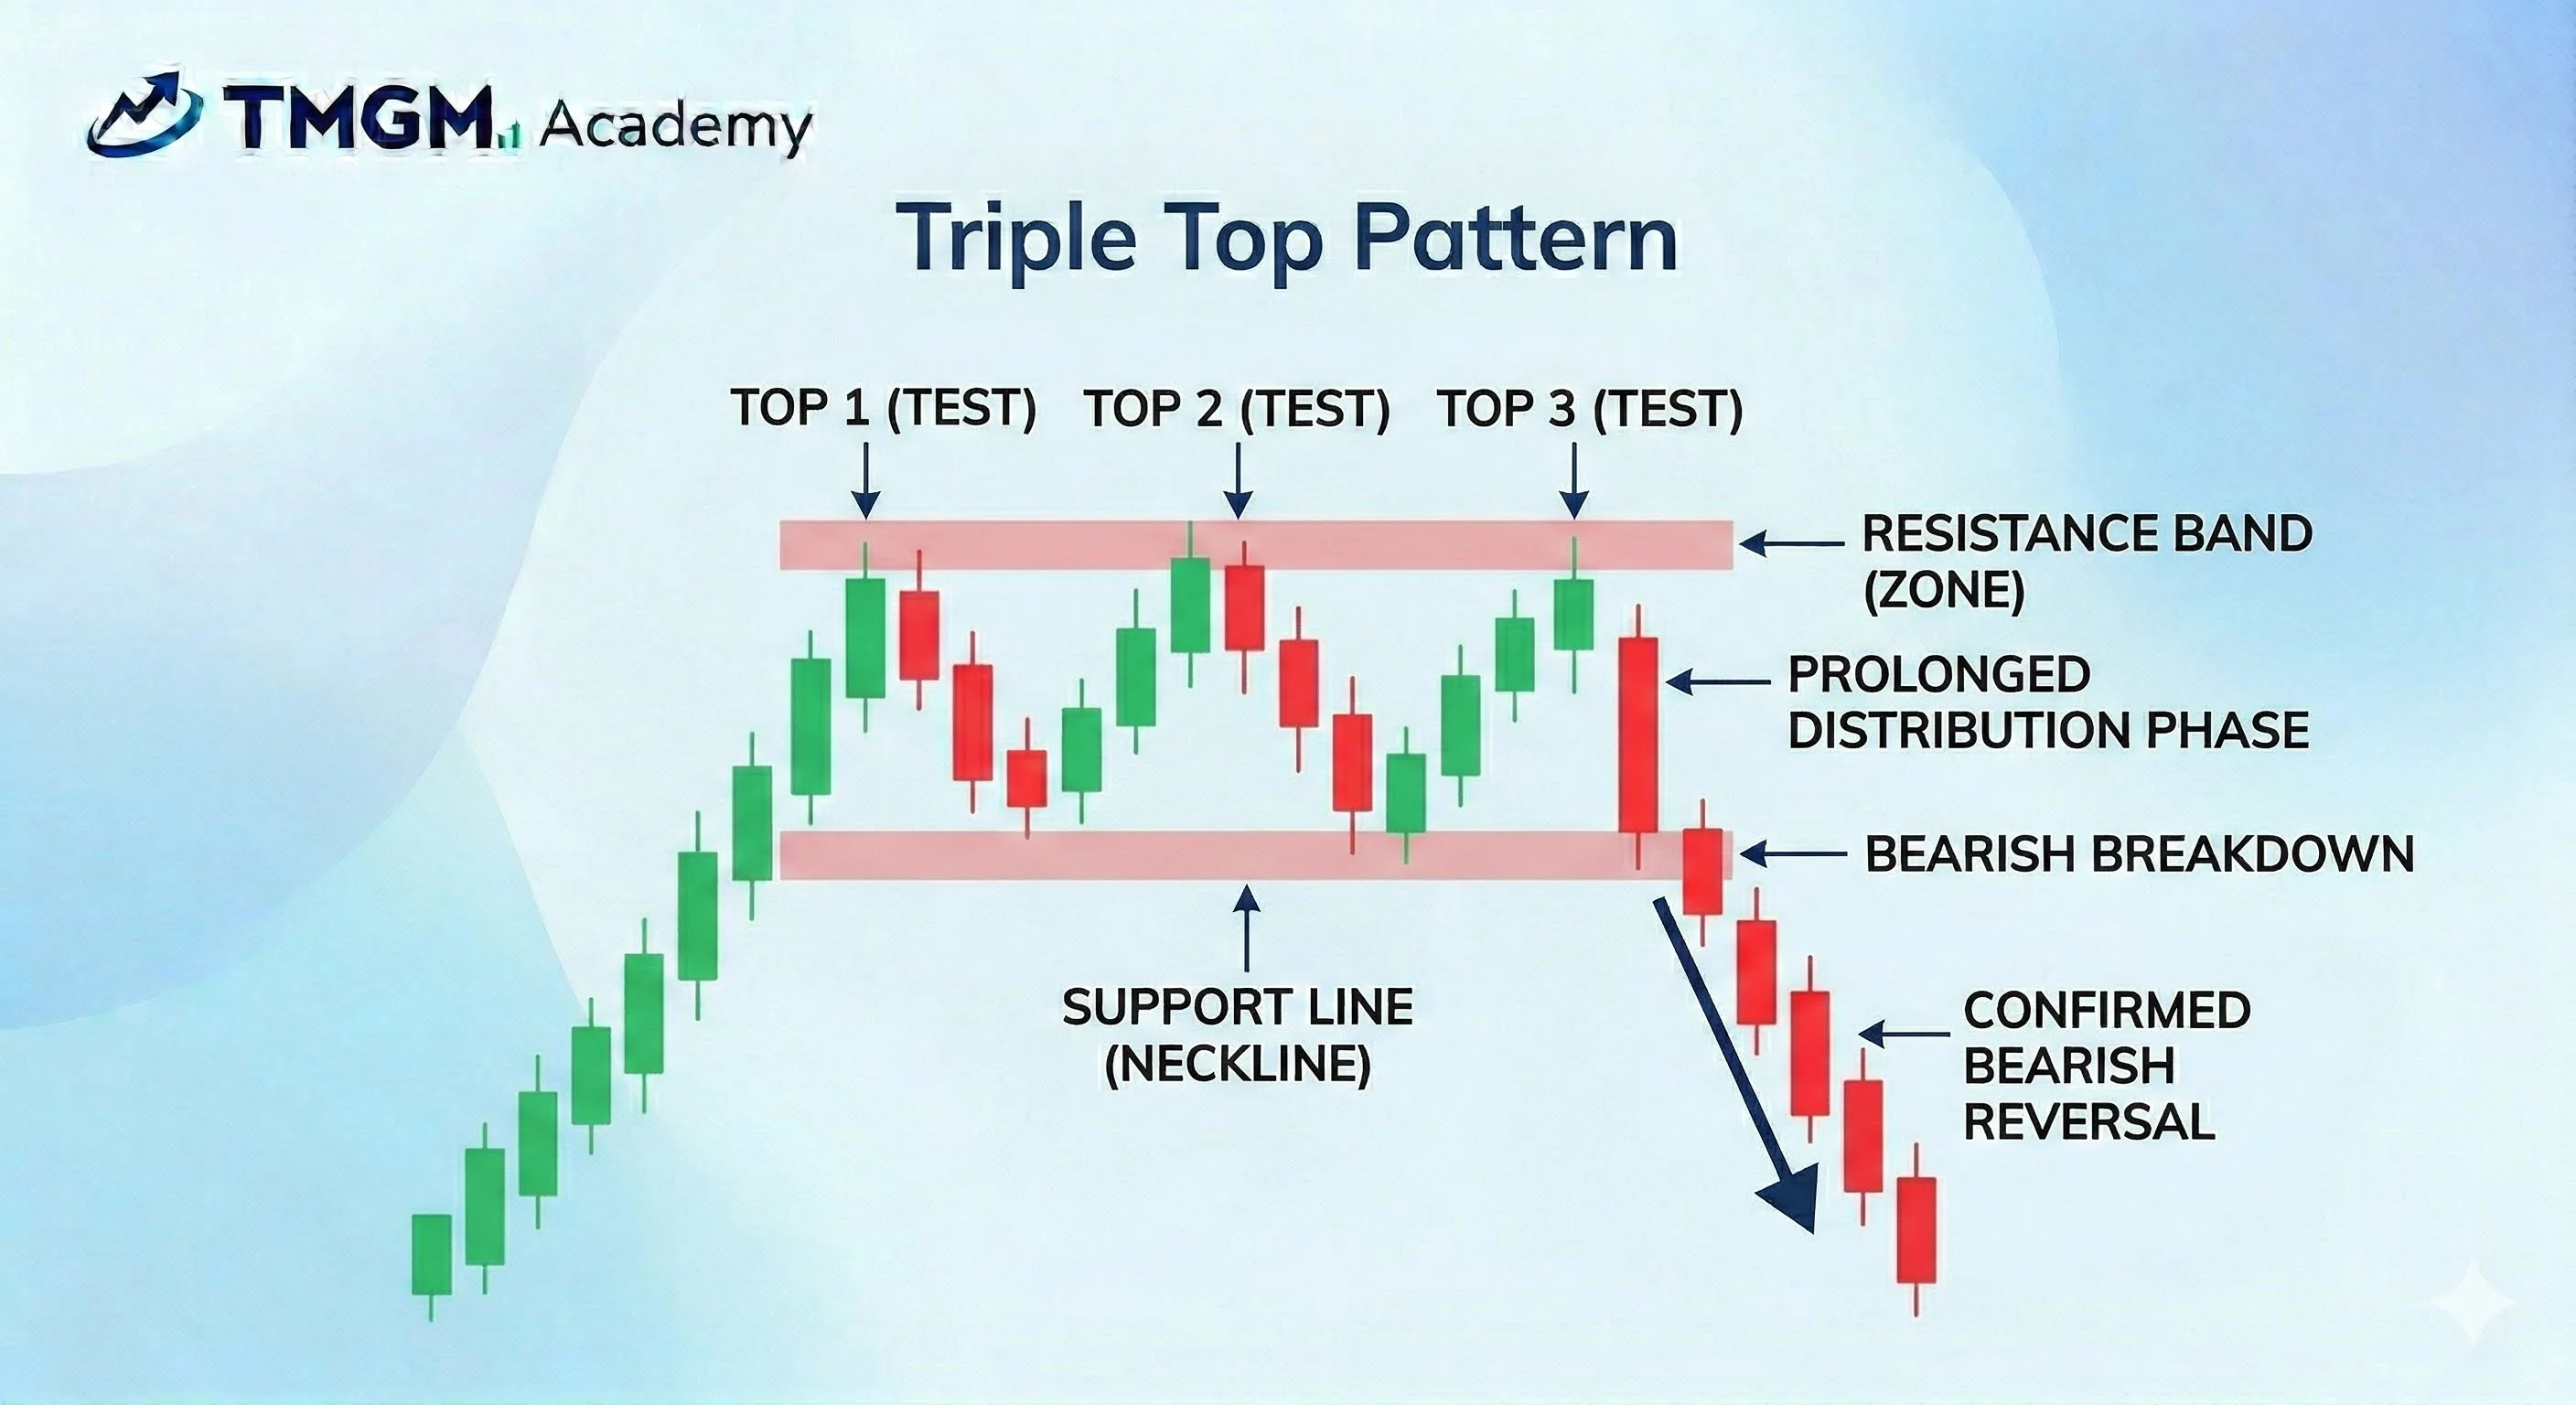
A triple top pattern forms when price tests resistance three times and still fails to break higher.
Image placeholder: Triple Top Pattern
The repeated rejection usually shows that buyers are struggling to extend the uptrend. Traders often wait for a break below support under the structure, while a strong move above resistance invalidates the bearish thesis.
Triple Bottom Pattern
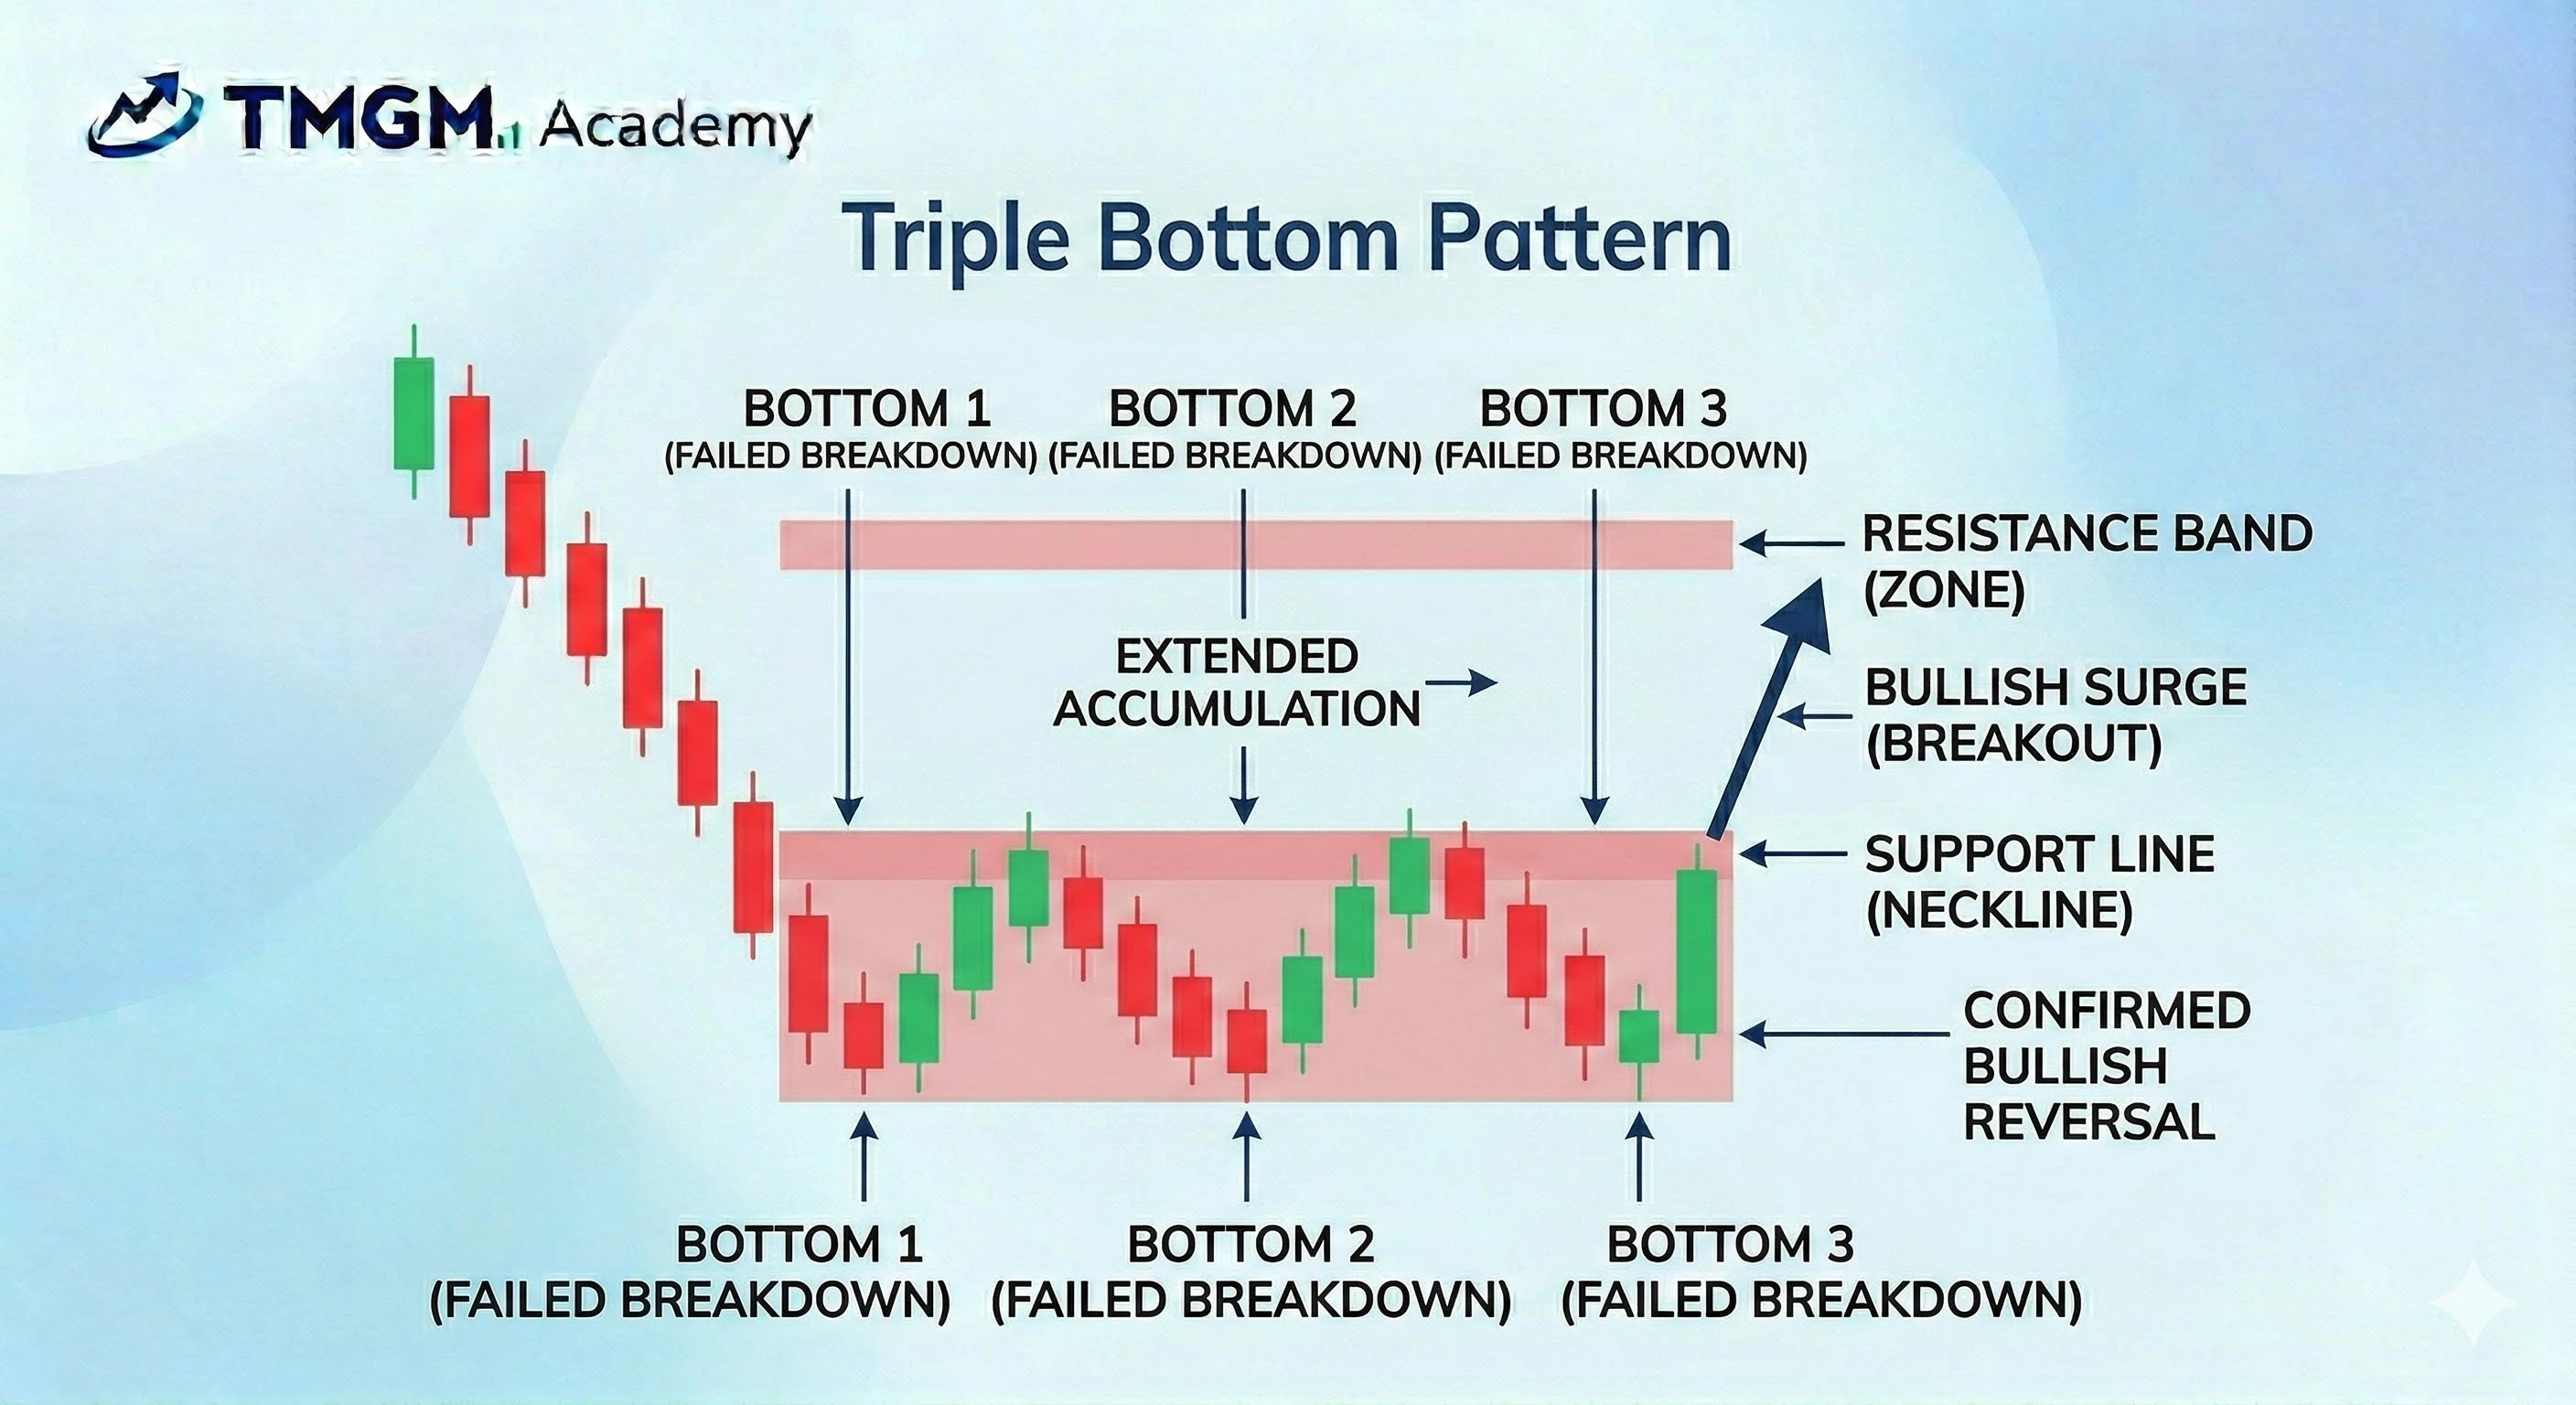
A triple bottom pattern forms when price tests support three times and still fails to break lower.
Image placeholder: Triple Bottom Pattern
The repeated defence usually shows that sellers are losing control near the floor of the range. Traders often wait for a breakout above resistance, while a decisive move below support invalidates the bullish reversal view.
Rising Wedge Pattern
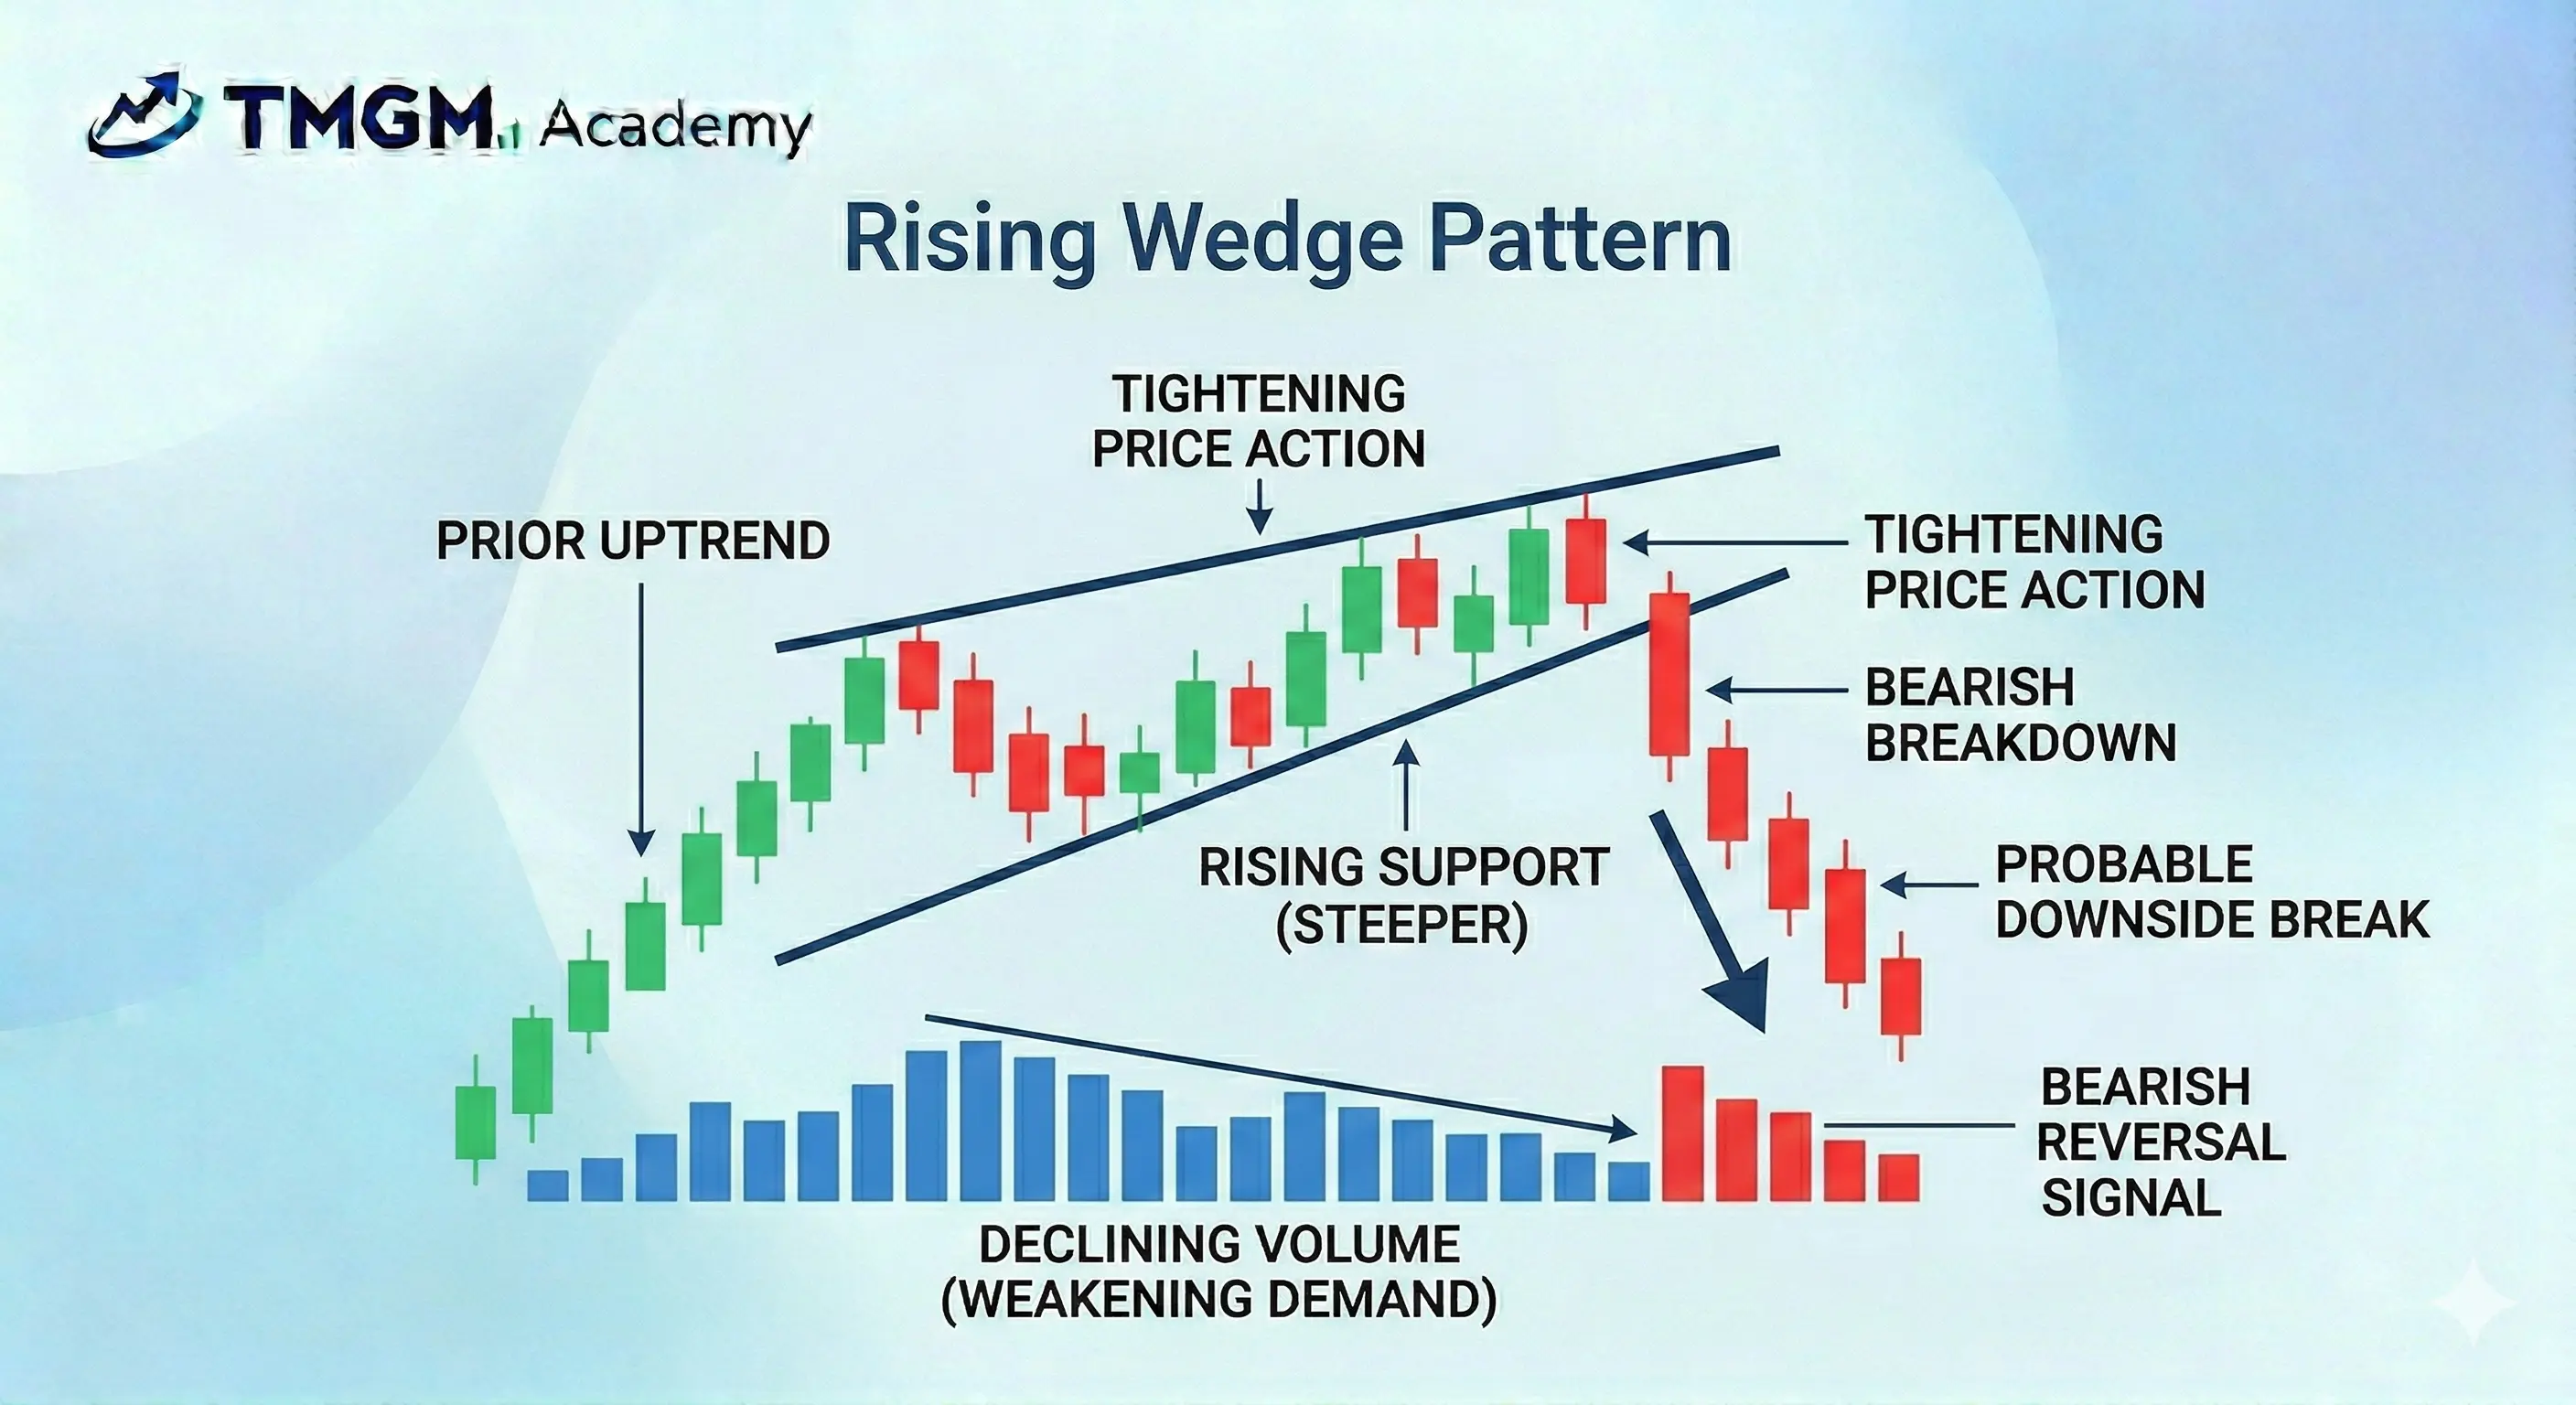
A rising wedge pattern forms when price continues higher inside two converging upward sloping trendlines.
Image placeholder: Rising Wedge Pattern
The structure often signals weakening upside momentum because price keeps rising while the range tightens. Traders usually wait for a break below the lower wedge boundary, while a strong breakout above resistance can change the interpretation.
Falling Wedge Pattern
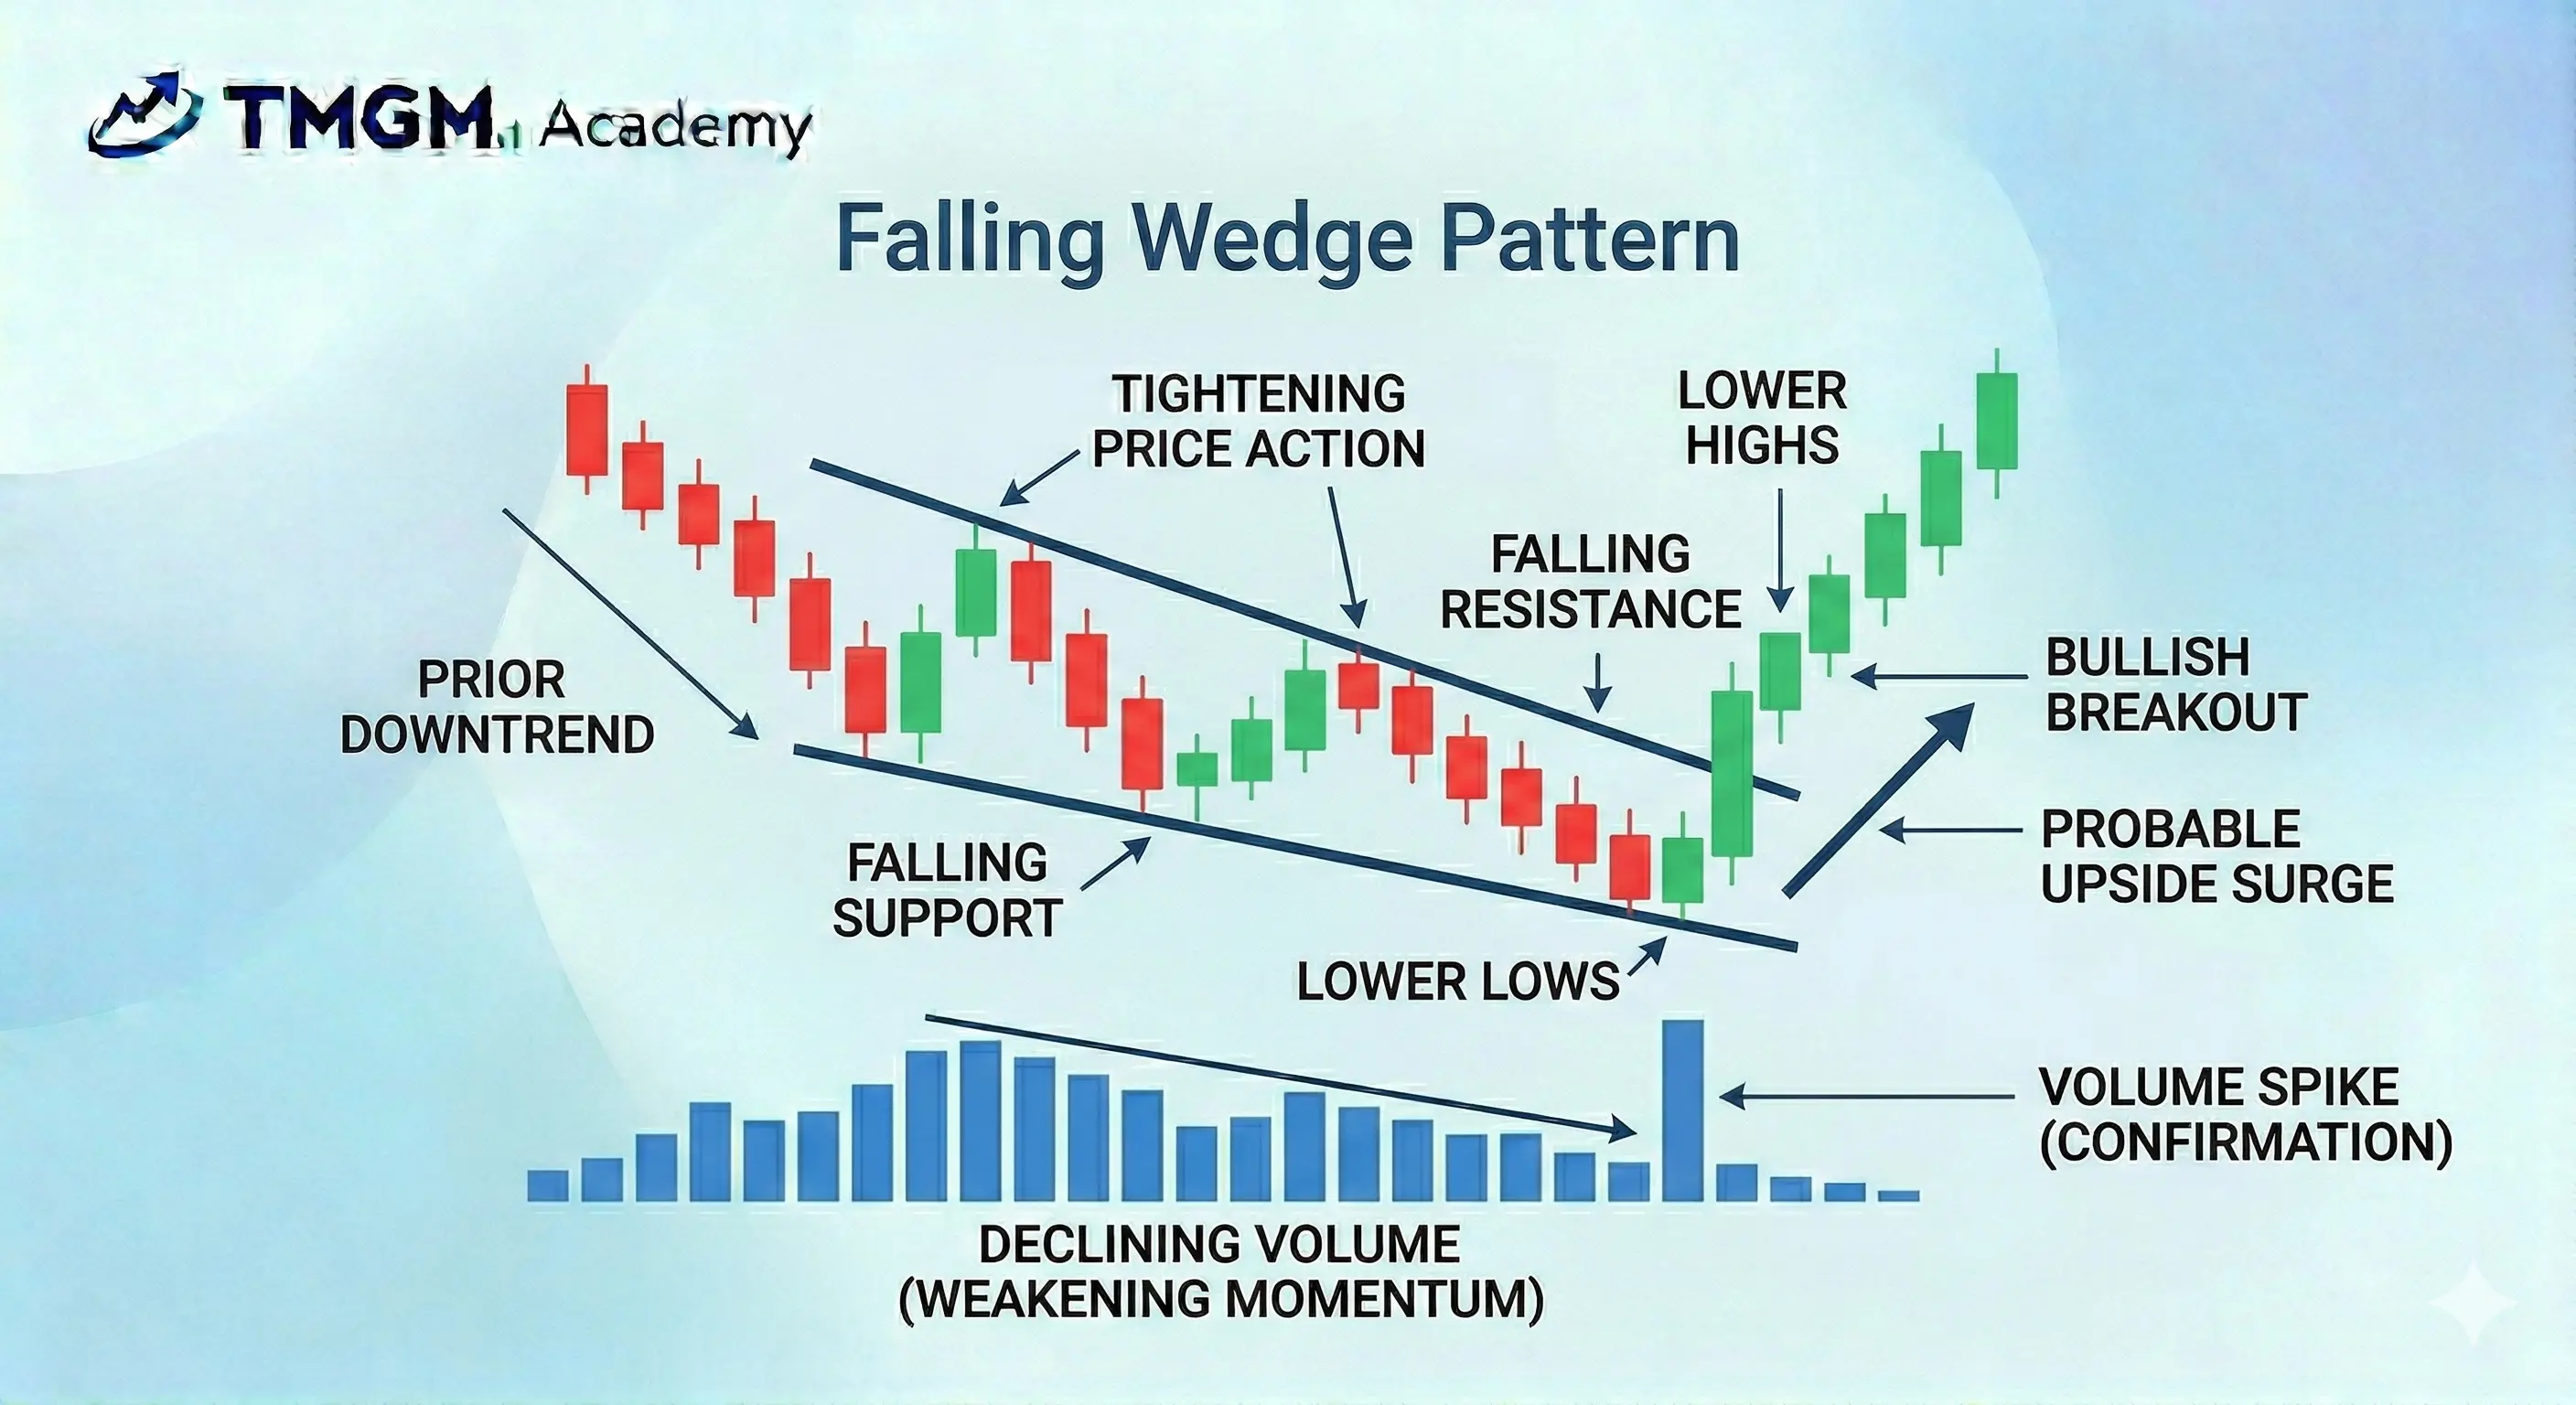
A falling wedge pattern forms when price continues lower inside two converging downward sloping trendlines.
Image placeholder: Falling Wedge Pattern
The structure often signals weakening downside momentum as the range narrows. Traders usually wait for a break above the upper wedge boundary, while a fresh breakdown below support weakens the bullish reversal case.
Bilateral Chart Patterns
Bilateral chart patterns form when price compresses into a structure that can break in either direction. Traders should treat them as neutral until the market closes outside the pattern with clear intent.
Ascending Triangle Pattern
An ascending triangle pattern forms when price presses into flat resistance while printing higher lows underneath.
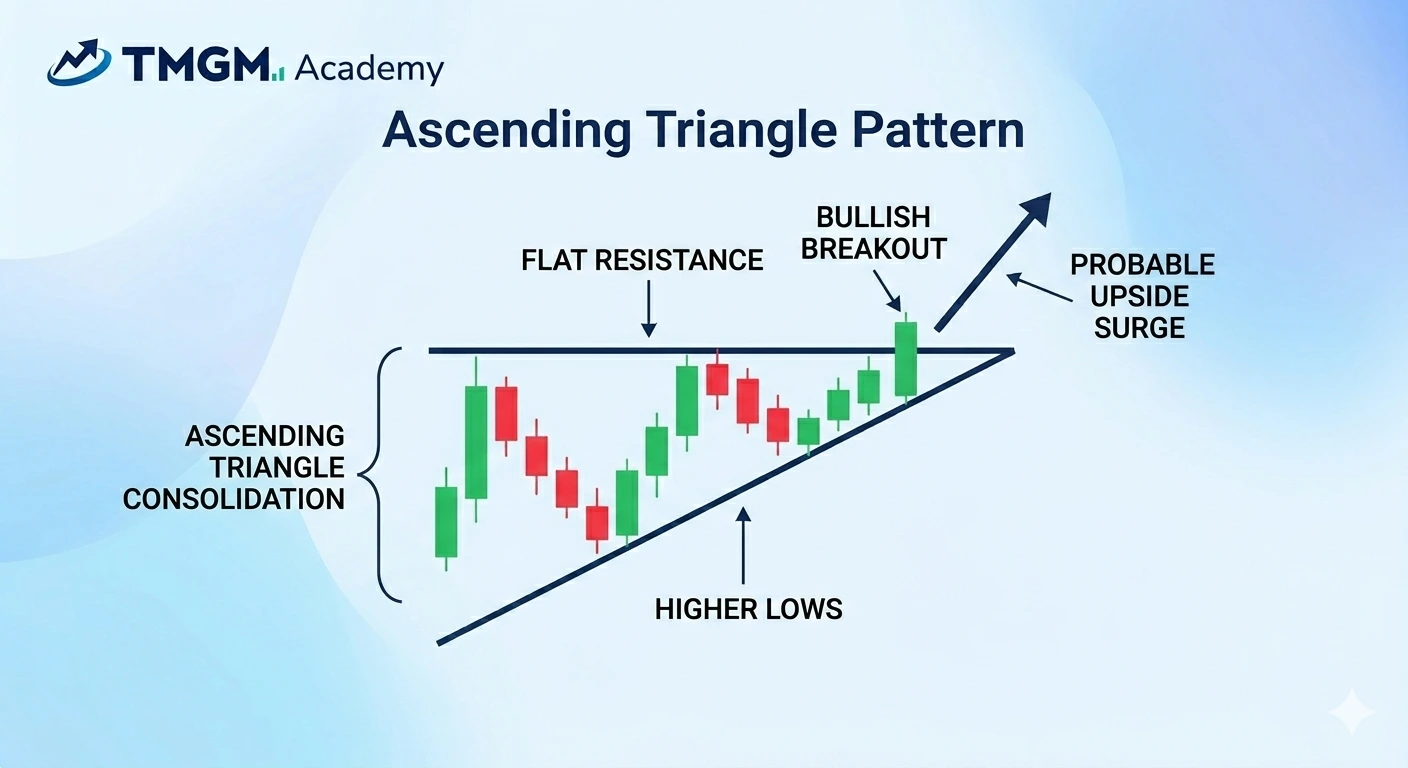
The structure usually shows growing buying pressure against a fixed ceiling. Traders often look for a breakout above resistance, while a failure that breaks rising support weakens the bullish bias.
Descending Triangle Pattern
A descending triangle pattern forms when price presses into flat support while printing lower highs above it.

The structure usually shows growing selling pressure against a fixed floor. Traders often look for a breakdown below support, while a breakout above descending resistance weakens the bearish bias.
Symmetrical Triangle Pattern

A symmetrical triangle pattern forms when price compresses between a falling resistance line and a rising support line.
Image placeholder: Symmetrical Triangle Pattern
The structure reflects consolidation and indecision rather than a fixed directional bias.
Pro Tip: Traders usually wait for a confirmed breakout before taking a view, because the eventual move can develop on either side of the pattern.
How to Trade Chart Patterns
Trend continuation setups
A continuation trade starts with a clear prior trend. The trader then waits for a controlled pause, such as a flag, pennant, rectangle, or cup and handle, and looks for price to break in the direction of the original move.
The cleanest entry usually comes after a confirmed breakout close above resistance in bullish setups or below support in bearish setups. Some traders enter on the breakout itself, while others wait for a retest of the broken level to reduce false entries.
Trend reversal setups
A reversal trade requires more proof because the trader is challenging the prior trend. In head and shoulders, double top, or triple top setups, that proof often comes when price breaks the neckline or support zone that held the structure together.
In bullish reversal setups such as inverse head and shoulders or double bottom, traders often wait for a break above neckline resistance before acting. Entering before confirmation may improve price, but it also increases the chance of being trapped in a failed reversal.
Bilateral breakout setups
A bilateral setup demands patience. The trader should treat triangles and other compression structures as neutral until price closes outside the boundary with clear intent.
Volume matters here. A breakout supported by expanding volume and a decisive close is usually more reliable than a weak push through the level that immediately fades back into the range.
Entry, stop loss, and take profit
The entry should make sense relative to the structure. A stop loss belongs beyond the level that proves the setup is wrong, not at an arbitrary distance.
A common target method is the measured move, where the trader projects the height of the pattern from the breakout point. Traders can also use the next major support or resistance area as a more realistic target, especially when volatility is high or the pattern is very wide.
Risk management and key considerations
Three factors separate useful chart pattern trading from weak pattern spotting. They are volume, duration, and context.
Volume helps confirm whether participation is expanding at the breakout. Duration matters because a pattern that forms cleanly over time often carries more weight than a rushed structure on a noisy chart.
Context matters most of all. A bullish pattern forming directly under strong higher timeframe resistance is weaker than the same pattern forming after a healthy pullback in an existing uptrend.
Chart patterns also come with hidden risks. A visually clean setup can still be a poor trade if the stop loss is too wide, the target is too close, or the market is near a major event that can distort price action.
No chart pattern offers a guarantee. A pattern is a probability framework, not a prediction machine, so position sizing and total account risk still matter more than finding the perfect shape.
Chart Patterns FAQ
What is the most reliable chart pattern?
No single chart pattern is always the most reliable. Reliability depends on trend context, volume confirmation, timeframe quality, and whether the trader waits for a proper breakout or neckline break.
Are chart patterns useful for intraday trading?
Yes, chart patterns can be useful for intraday trading, especially on liquid markets with clear participation. Traders should still expect more noise on lower timeframes, which makes confirmation and risk control even more important.
Can chart patterns work without volume confirmation?
They can still work, but the trade quality is usually lower. Volume is not the only confirmation tool, but a breakout without volume support is more vulnerable to failure and fast reversal.